[GUEST ACCESS MODE: Data is scrambled or limited to provide examples. Make requests using your API key to unlock full data. Check https://lunarcrush.ai/auth for authentication information.]  TiltFolio [@TiltFolio](/creator/twitter/TiltFolio) on x XXX followers Created: 2025-07-24 14:18:54 UTC @unusual_whales Here's one way to see this: The ratio of $SOX (semiconductor stock index) versus $SPX (the broader index) is at a similar ratio to 1999 - the peak of the last bubble. Green candles = 20-week highs. Bullish trend here. FYI - our free indicator is applied to the chart below 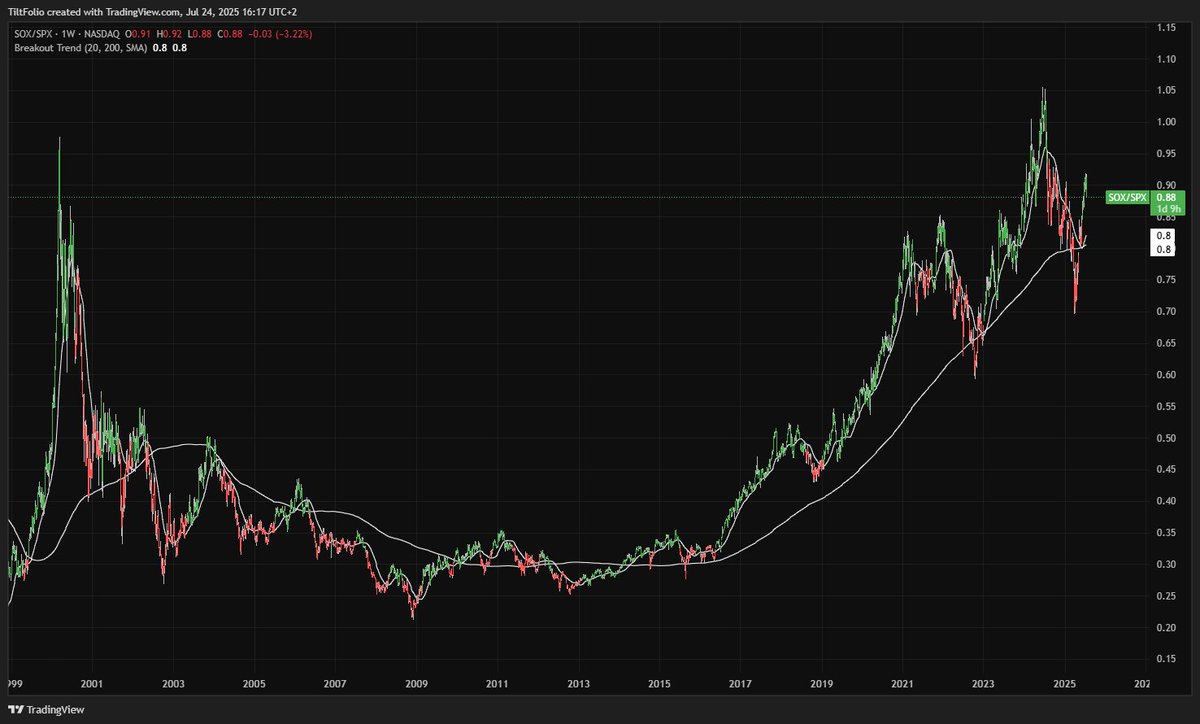 XXX engagements  **Related Topics** [spx](/topic/spx) [applied](/topic/applied) [bubble](/topic/bubble) [$spx](/topic/$spx) [$0981hk](/topic/$0981hk) [$sox](/topic/$sox) [Post Link](https://x.com/TiltFolio/status/1948387420048699542)
[GUEST ACCESS MODE: Data is scrambled or limited to provide examples. Make requests using your API key to unlock full data. Check https://lunarcrush.ai/auth for authentication information.]
 TiltFolio @TiltFolio on x XXX followers
Created: 2025-07-24 14:18:54 UTC
TiltFolio @TiltFolio on x XXX followers
Created: 2025-07-24 14:18:54 UTC
@unusual_whales Here's one way to see this:
The ratio of $SOX (semiconductor stock index) versus $SPX (the broader index) is at a similar ratio to 1999 - the peak of the last bubble.
Green candles = 20-week highs. Bullish trend here.
FYI - our free indicator is applied to the chart below

XXX engagements
