[GUEST ACCESS MODE: Data is scrambled or limited to provide examples. Make requests using your API key to unlock full data. Check https://lunarcrush.ai/auth for authentication information.]  Albert Alan [@_AlbertAlan](/creator/twitter/_AlbertAlan) on x 2917 followers Created: 2025-07-21 19:42:20 UTC Dear $OPEN Investors, Let’s break down what’s happening with Opendoor, especially for those who are newer to the market. Opendoor has approximately XXXXXX million shares outstanding. That means just over XXX million shares actually exist and are held by investors. However, in a single recent trading session, we saw XXXX billion shares traded. In plain terms, the entire share count turned over more than twice in one day. So how is that possible? Trading volume counts how many times shares change hands, not how many shares actually exist. If a single share is bought and sold multiple times in a day, each trade adds to the volume. Think of it like a game of hot potato one trader passes the share to another, who quickly passes it again, and again. The share might be flipped dozens of times in a single session, especially in a frenzy like this. Opendoor’s stock price ran from XX cents to a high of $XXXX an XXX percent move — despite the company still being unprofitable. And just today, we saw XXXX million shares traded in a single minute, which caused the price to collapse from $XXXX to $XXXX in real time. That kind of price action doesn’t come from long-term investors it comes from fast-moving speculation and algorithmic selling. Yesterday, we published a proprietary institutional analysis that revealed a concerning pattern: institutions have been systematically offloading shares into this rally. We reviewed XXX institutional transactions and found that many of the largest players are not taking profits they are cutting losses. Our model showed that institutions are selling in coordinated bands, with selling activity happening between $XX and $14, and significant activity even in the $X to $X range. This is not random behavior. It’s defensive selling a strategy to quietly exit risk positions while retail excitement drives price higher. The data is clear. Institutions like Renaissance Technologies, Morgan Stanley, and Goldman Sachs have liquidated over XX million shares, and our analysis estimates over XX million more shares are set to sell into the rally. That’s more than eight days' worth of average volume. Retail buying can’t absorb that kind of supply and institutions know it. We also calculated a Liquidity Absorption Ratio (LAR) of XXX percent at key resistance levels, which means it would take XXXX full days of trading volume just to soak up institutional selling. That creates a price ceiling. Once the stock enters those zones, the math shows a high probability of reversal not continuation. Our modeling predicts less than a XXXX percent chance that OPEN can reach and sustain prices above $XX. The takeaway is simple. This rally isn't organic. It's driven by retail enthusiasm, while institutions use that volume as exit liquidity. If you’re buying here without understanding this structure, you’re essentially catching shares that smart money is trying to unload. This isn't speculation it’s a transfer of risk, and retail is on the receiving end. 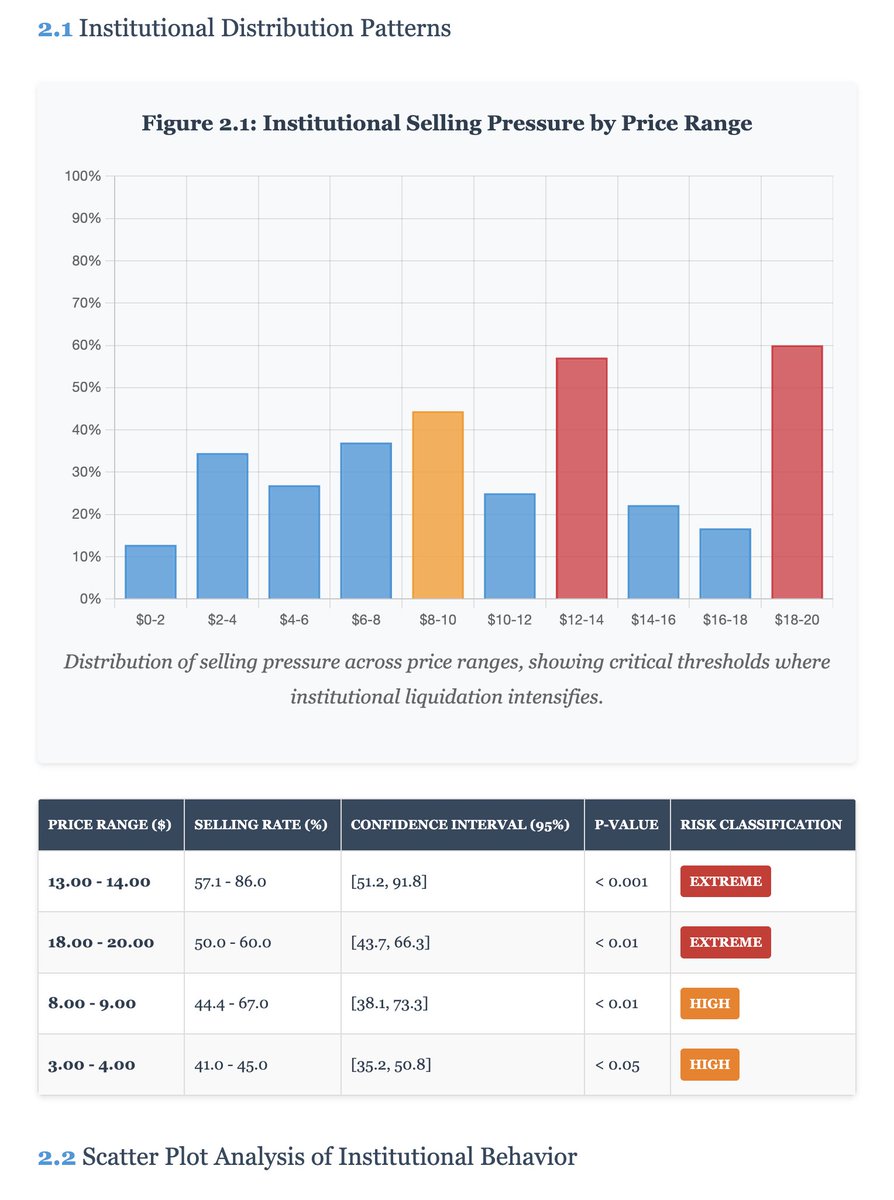 XXXXXXX engagements  **Related Topics** [stocks](/topic/stocks) [$open](/topic/$open) [open opendoor technologies inc](/topic/open-opendoor-technologies-inc) [Post Link](https://x.com/_AlbertAlan/status/1947381649853059439)
[GUEST ACCESS MODE: Data is scrambled or limited to provide examples. Make requests using your API key to unlock full data. Check https://lunarcrush.ai/auth for authentication information.]
 Albert Alan @_AlbertAlan on x 2917 followers
Created: 2025-07-21 19:42:20 UTC
Albert Alan @_AlbertAlan on x 2917 followers
Created: 2025-07-21 19:42:20 UTC
Dear $OPEN Investors,
Let’s break down what’s happening with Opendoor, especially for those who are newer to the market.
Opendoor has approximately XXXXXX million shares outstanding. That means just over XXX million shares actually exist and are held by investors. However, in a single recent trading session, we saw XXXX billion shares traded. In plain terms, the entire share count turned over more than twice in one day. So how is that possible?
Trading volume counts how many times shares change hands, not how many shares actually exist. If a single share is bought and sold multiple times in a day, each trade adds to the volume. Think of it like a game of hot potato one trader passes the share to another, who quickly passes it again, and again. The share might be flipped dozens of times in a single session, especially in a frenzy like this.
Opendoor’s stock price ran from XX cents to a high of $XXXX an XXX percent move — despite the company still being unprofitable. And just today, we saw XXXX million shares traded in a single minute, which caused the price to collapse from $XXXX to $XXXX in real time. That kind of price action doesn’t come from long-term investors it comes from fast-moving speculation and algorithmic selling.
Yesterday, we published a proprietary institutional analysis that revealed a concerning pattern: institutions have been systematically offloading shares into this rally. We reviewed XXX institutional transactions and found that many of the largest players are not taking profits they are cutting losses. Our model showed that institutions are selling in coordinated bands, with selling activity happening between $XX and $14, and significant activity even in the $X to $X range. This is not random behavior. It’s defensive selling a strategy to quietly exit risk positions while retail excitement drives price higher.
The data is clear. Institutions like Renaissance Technologies, Morgan Stanley, and Goldman Sachs have liquidated over XX million shares, and our analysis estimates over XX million more shares are set to sell into the rally. That’s more than eight days' worth of average volume. Retail buying can’t absorb that kind of supply and institutions know it.
We also calculated a Liquidity Absorption Ratio (LAR) of XXX percent at key resistance levels, which means it would take XXXX full days of trading volume just to soak up institutional selling. That creates a price ceiling. Once the stock enters those zones, the math shows a high probability of reversal not continuation. Our modeling predicts less than a XXXX percent chance that OPEN can reach and sustain prices above $XX.
The takeaway is simple. This rally isn't organic. It's driven by retail enthusiasm, while institutions use that volume as exit liquidity. If you’re buying here without understanding this structure, you’re essentially catching shares that smart money is trying to unload. This isn't speculation it’s a transfer of risk, and retail is on the receiving end.

XXXXXXX engagements

Related Topics stocks $open open opendoor technologies inc