[GUEST ACCESS MODE: Data is scrambled or limited to provide examples. Make requests using your API key to unlock full data. Check https://lunarcrush.ai/auth for authentication information.]  Steve Jacobs [@SteveDJacobs](/creator/twitter/SteveDJacobs) on x 3547 followers Created: 2025-07-20 06:11:49 UTC Liquid Leaders - RS Weekly Vs Monthly Improving 📈 $CRM $NOW $PANW $ENB $WM $ADSK $WDAY $AXON $TEAM $VEEV $NRG $HUBS $CQP Weakening 📉 $META $HD $ABBV $WFC $MS $LIN $AXP $TXN $UBER $BKNG $QCOM $SPGI $TMO $AMAT $COF $BHP $LRCX $ADI $MSTR $NKE $SBUX $DASH $INTC $CEG $PNC $USB $VST $HLT $CRH $TFC $URI $TRGP $DAL $NNNN The chart shows the Relative Strength (RS) of the "Liquid Leaders" comparing the weekly RS with the monthly RS. While it can be difficult to read the quadrants 'Strong' and 'Weak', particularly in the corners, I find the real value comes from the quadrants "Improving" and "Weakening"where weekly and monthly RS diverge. Note: It is not a Relative Rotation Graph (RRG) - there are XXX tickers which may render it (even more) difficult to read. 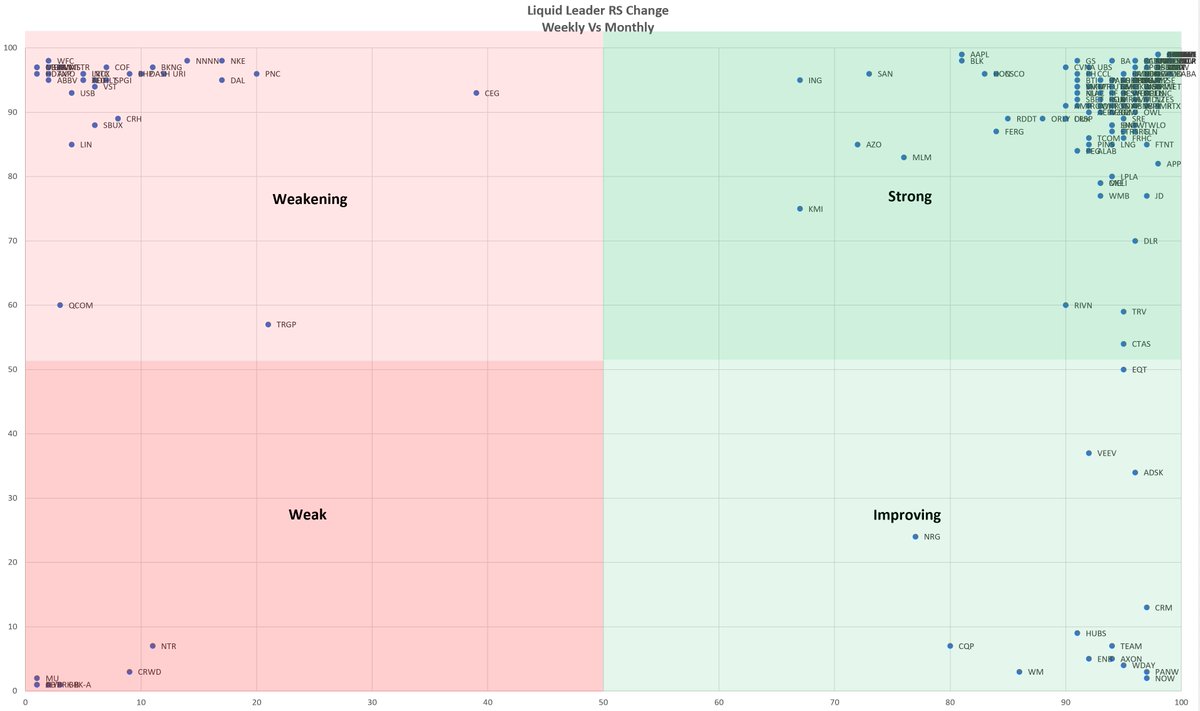 XXXXX engagements  **Related Topics** [vst](/topic/vst) [usb](/topic/usb) [intc](/topic/intc) [nke](/topic/nke) [mstr](/topic/mstr) [lin](/topic/lin) [abbv](/topic/abbv) [meta](/topic/meta) [Post Link](https://x.com/SteveDJacobs/status/1946815287426486708)
[GUEST ACCESS MODE: Data is scrambled or limited to provide examples. Make requests using your API key to unlock full data. Check https://lunarcrush.ai/auth for authentication information.]
 Steve Jacobs @SteveDJacobs on x 3547 followers
Created: 2025-07-20 06:11:49 UTC
Steve Jacobs @SteveDJacobs on x 3547 followers
Created: 2025-07-20 06:11:49 UTC
Liquid Leaders - RS Weekly Vs Monthly
Improving 📈 $CRM $NOW $PANW $ENB $WM $ADSK $WDAY $AXON $TEAM $VEEV $NRG $HUBS $CQP
Weakening 📉 $META $HD $ABBV $WFC $MS $LIN $AXP $TXN $UBER $BKNG $QCOM $SPGI $TMO $AMAT $COF $BHP $LRCX $ADI $MSTR $NKE $SBUX $DASH $INTC $CEG $PNC $USB $VST $HLT $CRH $TFC $URI $TRGP $DAL $NNNN
The chart shows the Relative Strength (RS) of the "Liquid Leaders" comparing the weekly RS with the monthly RS. While it can be difficult to read the quadrants 'Strong' and 'Weak', particularly in the corners, I find the real value comes from the quadrants "Improving" and "Weakening"where weekly and monthly RS diverge.
Note: It is not a Relative Rotation Graph (RRG) - there are XXX tickers which may render it (even more) difficult to read.

XXXXX engagements
