[GUEST ACCESS MODE: Data is scrambled or limited to provide examples. Make requests using your API key to unlock full data. Check https://lunarcrush.ai/auth for authentication information.]  David Levenson. It's time to reduce Lev Vega Cap [@levenson_david](/creator/twitter/levenson_david) on x 14.1K followers Created: 2025-07-20 04:15:29 UTC On Friday, July 18, 2025 NVDA/Global GDP was XXX% times its market capitalization to global GDP as what CSCO/Global GDP was at the peak of DOT COM era. On June 11, 2025 NVDA was XXX% of global GDP when it was at $145/share. On Friday, July 18, 2025 at $172.41/share NVDA rose XXXX% of global GDP. Greenspan had XXXX% Fed funds rate on May 6, 2000 and didn’t lower rates until an unscheduled conference call on January 3, 2001 after the NDX has fallen XX% over the prior XX weeks and X days 3/24/00-1/3/01. Powell had XXXXX of Fed funds and an equivalent of 90bp of QT for a total level of policy at XXXXX when it was at peak tight policy before the June 12, 2024 QT reduction of $XXX billion annual. Since then, Powell lowered FFR to XXXXX% late last year and reduced QT a further $XXX billion on March 18, 2025. Beyond that Powell’s forward guidance has the December 2026 FFR/SOFR at XXXXXX (3.205%). That is 2.17%(BP)lower FFR and 66BP for a total of XXXX bp of easing out of XXXXX policy at its peak. This is a XX% reduction of potential policy. The residual XX% as a denominator of XXX% means 267%/55%=4.855. This means AI is XXXXX times as risky ad Dot Com. @hendry_hugh @GrantCardone @davevermilion @nickthewombat The concentration chart below is old and the AI spike would be much higher if it was updated. 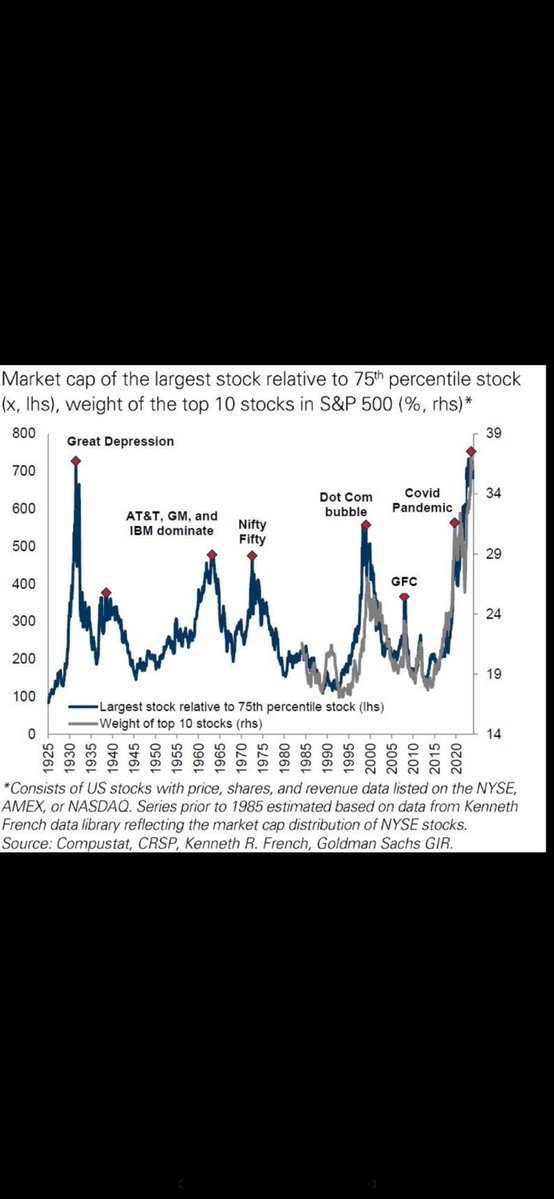 XXXXX engagements  **Related Topics** [vega](/topic/vega) [rates](/topic/rates) [fed](/topic/fed) [$17241share](/topic/$17241share) [$145share](/topic/$145share) [nvda](/topic/nvda) [dot](/topic/dot) [gdp](/topic/gdp) [Post Link](https://x.com/levenson_david/status/1946786013885653280)
[GUEST ACCESS MODE: Data is scrambled or limited to provide examples. Make requests using your API key to unlock full data. Check https://lunarcrush.ai/auth for authentication information.]
 David Levenson. It's time to reduce Lev Vega Cap @levenson_david on x 14.1K followers
Created: 2025-07-20 04:15:29 UTC
David Levenson. It's time to reduce Lev Vega Cap @levenson_david on x 14.1K followers
Created: 2025-07-20 04:15:29 UTC
On Friday, July 18, 2025 NVDA/Global GDP was XXX% times its market capitalization to global GDP as what CSCO/Global GDP was at the peak of DOT COM era.
On June 11, 2025 NVDA was XXX% of global GDP when it was at $145/share.
On Friday, July 18, 2025 at $172.41/share NVDA rose XXXX% of global GDP.
Greenspan had XXXX% Fed funds rate on May 6, 2000 and didn’t lower rates until an unscheduled conference call on January 3, 2001 after the NDX has fallen XX% over the prior XX weeks and X days 3/24/00-1/3/01.
Powell had XXXXX of Fed funds and an equivalent of 90bp of QT for a total level of policy at XXXXX when it was at peak tight policy before the June 12, 2024 QT reduction of $XXX billion annual.
Since then, Powell lowered FFR to XXXXX% late last year and reduced QT a further $XXX billion on March 18, 2025.
Beyond that Powell’s forward guidance has the December 2026 FFR/SOFR at XXXXXX (3.205%).
That is 2.17%(BP)lower FFR and 66BP for a total of XXXX bp of easing out of XXXXX policy at its peak.
This is a XX% reduction of potential policy. The residual XX% as a denominator of XXX% means 267%/55%=4.855.
This means AI is XXXXX times as risky ad Dot Com.
@hendry_hugh @GrantCardone @davevermilion @nickthewombat
The concentration chart below is old and the AI spike would be much higher if it was updated.

XXXXX engagements

Related Topics vega rates fed $17241share $145share nvda dot gdp