[GUEST ACCESS MODE: Data is scrambled or limited to provide examples. Make requests using your API key to unlock full data. Check https://lunarcrush.ai/auth for authentication information.]  Neil Sethi [@neilksethi](/creator/twitter/neilksethi) on x 12.3K followers Created: 2025-07-18 19:48:55 UTC June housing starts rebound +4.6% to 1.32mn SAAR, better than the +3.5% to 1.3mn expected (and after dropping -XXX% in May (which was the fifth move of at least X% in six months) to the least since May 2020). The rebound in June, like the drop in May, was all in multifamily which jumped +30.6% (after falling -XXXX in May), taking them to an annual pace of 414k, the second quickest (after April) since Dec ‘23, while single-family dropped -XXX% to 883k, the slowest since last July. Getting even more granular, the jump in MF starts was almost all in the NE where they rose by 76%, the most since Mar ‘23. I would have said earlier that I’m not sure how GDP trackers will take this as SF starts are more economically impactful, but the overall number was a beat, and it turns out they’re mostly taking it as a modest negative at this point. Total starts are +4.6% y/y w/SF -10.0%, but multifamily +25.8%. Starts fell in all regions but the NE (where they were boosted by the jump in MF starts). The South, which represents a little under XX% of all starts and two-thirds of SF starts, dropped -XXX% (SF -5.1%). All numbers m/m unless otherwise noted. SF = Single-family (1 unit); MF = multi-family (5+ units). Most of what is reported in the media is seasonally adjusted, so I will report on that basis as well. Finally, please note that this report is subject to significant revisions (for example the XX% confidence interval for housing starts m/m for this report is +-10.6%). 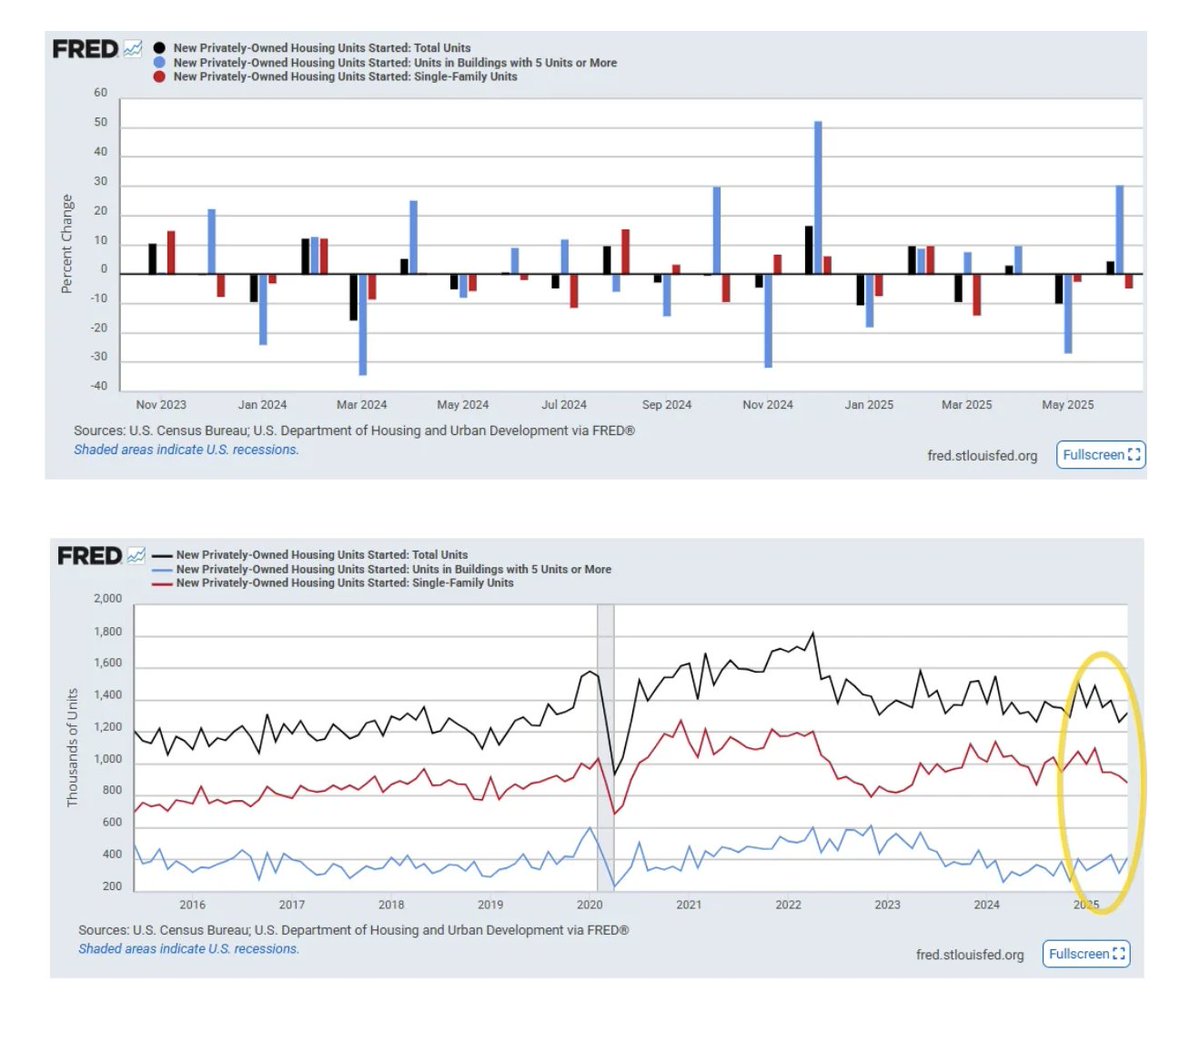 XXXXX engagements  **Related Topics** [neil](/topic/neil) [Post Link](https://x.com/neilksethi/status/1946296143534600430)
[GUEST ACCESS MODE: Data is scrambled or limited to provide examples. Make requests using your API key to unlock full data. Check https://lunarcrush.ai/auth for authentication information.]
 Neil Sethi @neilksethi on x 12.3K followers
Created: 2025-07-18 19:48:55 UTC
Neil Sethi @neilksethi on x 12.3K followers
Created: 2025-07-18 19:48:55 UTC
June housing starts rebound +4.6% to 1.32mn SAAR, better than the +3.5% to 1.3mn expected (and after dropping -XXX% in May (which was the fifth move of at least X% in six months) to the least since May 2020).
The rebound in June, like the drop in May, was all in multifamily which jumped +30.6% (after falling -XXXX in May), taking them to an annual pace of 414k, the second quickest (after April) since Dec ‘23, while single-family dropped -XXX% to 883k, the slowest since last July. Getting even more granular, the jump in MF starts was almost all in the NE where they rose by 76%, the most since Mar ‘23.
I would have said earlier that I’m not sure how GDP trackers will take this as SF starts are more economically impactful, but the overall number was a beat, and it turns out they’re mostly taking it as a modest negative at this point.
Total starts are +4.6% y/y w/SF -10.0%, but multifamily +25.8%.
Starts fell in all regions but the NE (where they were boosted by the jump in MF starts). The South, which represents a little under XX% of all starts and two-thirds of SF starts, dropped -XXX% (SF -5.1%).
All numbers m/m unless otherwise noted. SF = Single-family (1 unit); MF = multi-family (5+ units). Most of what is reported in the media is seasonally adjusted, so I will report on that basis as well. Finally, please note that this report is subject to significant revisions (for example the XX% confidence interval for housing starts m/m for this report is +-10.6%).

XXXXX engagements

Related Topics neil