[GUEST ACCESS MODE: Data is scrambled or limited to provide examples. Make requests using your API key to unlock full data. Check https://lunarcrush.ai/auth for authentication information.]  Ryan [@ryQuant](/creator/twitter/ryQuant) on x 8674 followers Created: 2025-07-18 19:10:26 UTC From a seasonality only perspective, we are right in the sweet spot for a top in risk assets, and a bottom in the $VIX. I made the chart below X years ago, and it's a lookback of the average VIX close each day of the past XX years, with all necessary time adjustments made (accounting for weekends and holidays.) When looking at the year, March and April, especially on Wall Street, brings the end of the cold winter and a warm/fun spring which I think, at the human condition/psychology level, creates conditions for optimism in markets. And this warm weather optimism tends to be fully "priced in" by the 3rd week in July, and that's supported by the VIX seasonality numbers below, with Vol rising throughout the better part of the next X months: Aug, Sept, Oct. There are also historical reasons for the regular increase in Vol in Sept-Oct, but I'm less familiar with these. It had something to do with farmers bringing their crops to market in Sept, after the summer harvest. Also, one thing to keep in mind with this data as it pertains to the March and Sept/Oct high points here is that, Covid and 2008 GFC pull those respective areas higher, but with XX years of data, I think that's plenty large of a sample size to extrapolate seasonality heuristics. 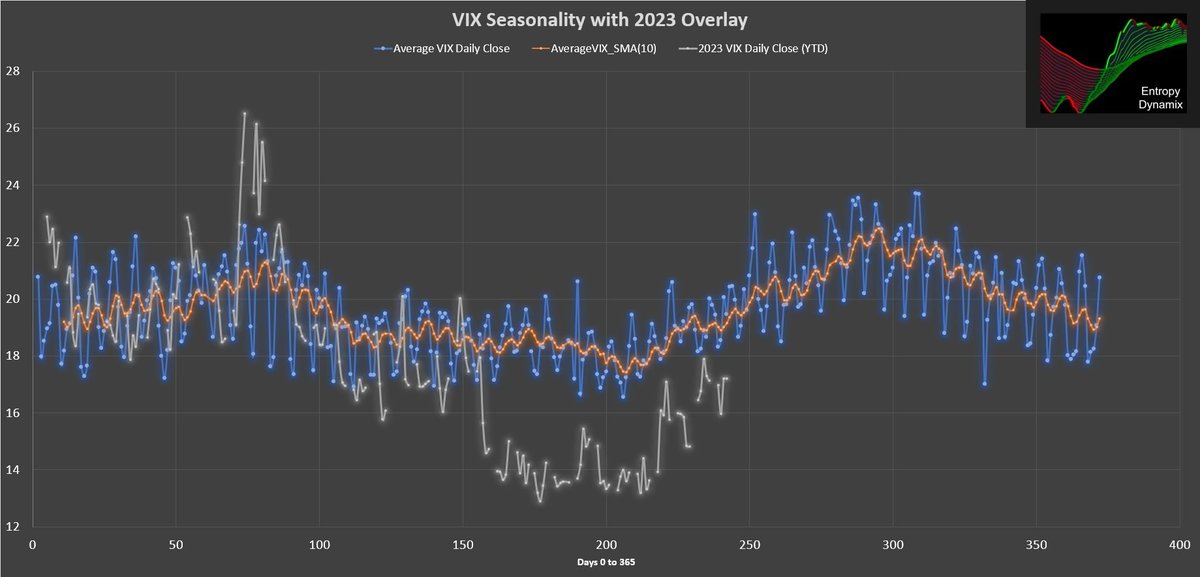 XXXXX engagements  **Related Topics** [wall street](/topic/wall-street) [accounting](/topic/accounting) [vix](/topic/vix) [$vix](/topic/$vix) [Post Link](https://x.com/ryQuant/status/1946286459557920973)
[GUEST ACCESS MODE: Data is scrambled or limited to provide examples. Make requests using your API key to unlock full data. Check https://lunarcrush.ai/auth for authentication information.]
 Ryan @ryQuant on x 8674 followers
Created: 2025-07-18 19:10:26 UTC
Ryan @ryQuant on x 8674 followers
Created: 2025-07-18 19:10:26 UTC
From a seasonality only perspective, we are right in the sweet spot for a top in risk assets, and a bottom in the $VIX.
I made the chart below X years ago, and it's a lookback of the average VIX close each day of the past XX years, with all necessary time adjustments made (accounting for weekends and holidays.)
When looking at the year, March and April, especially on Wall Street, brings the end of the cold winter and a warm/fun spring which I think, at the human condition/psychology level, creates conditions for optimism in markets.
And this warm weather optimism tends to be fully "priced in" by the 3rd week in July, and that's supported by the VIX seasonality numbers below, with Vol rising throughout the better part of the next X months: Aug, Sept, Oct.
There are also historical reasons for the regular increase in Vol in Sept-Oct, but I'm less familiar with these. It had something to do with farmers bringing their crops to market in Sept, after the summer harvest.
Also, one thing to keep in mind with this data as it pertains to the March and Sept/Oct high points here is that, Covid and 2008 GFC pull those respective areas higher, but with XX years of data, I think that's plenty large of a sample size to extrapolate seasonality heuristics.

XXXXX engagements

Related Topics wall street accounting vix $vix