[GUEST ACCESS MODE: Data is scrambled or limited to provide examples. Make requests using your API key to unlock full data. Check https://lunarcrush.ai/auth for authentication information.]  TiltFolio [@TiltFolio](/creator/twitter/TiltFolio) on x XXX followers Created: 2025-07-18 16:59:22 UTC @Mayhem4Markets As posted elsewhere: That chart is similar to semis versus the index, or the "AI" trade which HFs are getting wrong. Green candles signify 20-day highs, while red candles show 20-day lows. Simple often beats over-analysis! We publish this indicator free on TradingView 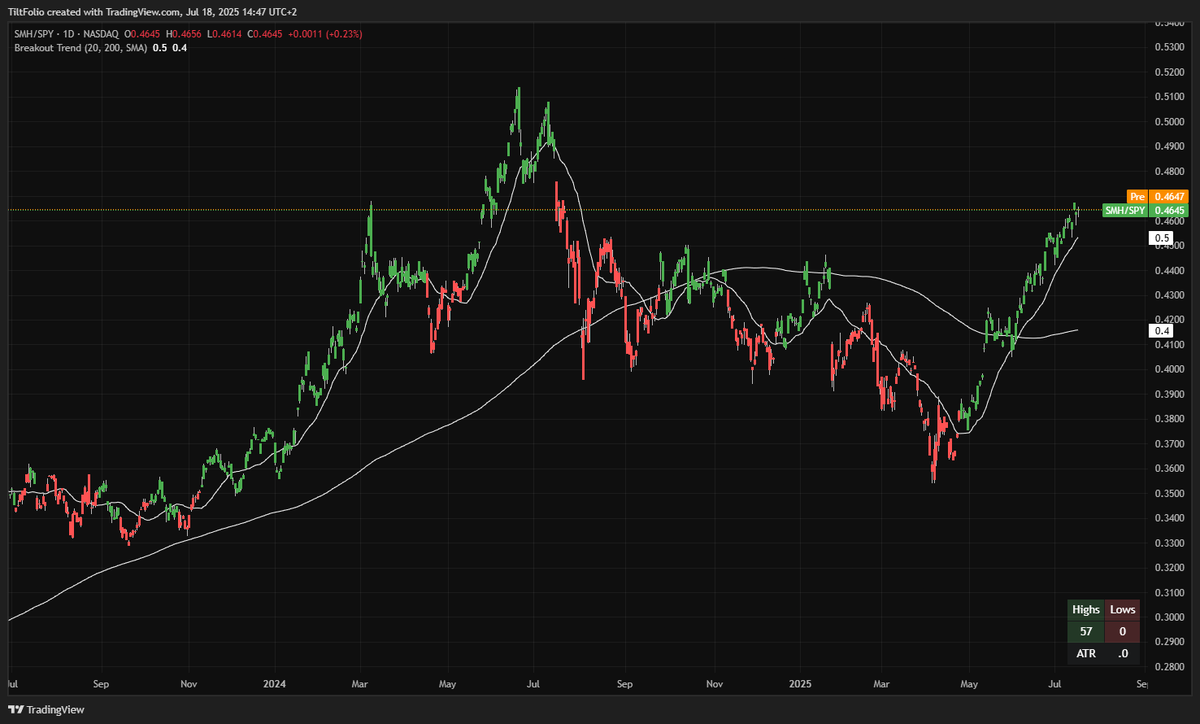 XX engagements  **Related Topics** [$lightas](/topic/$lightas) [coins ai](/topic/coins-ai) [Post Link](https://x.com/TiltFolio/status/1946253474301178099)
[GUEST ACCESS MODE: Data is scrambled or limited to provide examples. Make requests using your API key to unlock full data. Check https://lunarcrush.ai/auth for authentication information.]
 TiltFolio @TiltFolio on x XXX followers
Created: 2025-07-18 16:59:22 UTC
TiltFolio @TiltFolio on x XXX followers
Created: 2025-07-18 16:59:22 UTC
@Mayhem4Markets As posted elsewhere:
That chart is similar to semis versus the index, or the "AI" trade which HFs are getting wrong.
Green candles signify 20-day highs, while red candles show 20-day lows. Simple often beats over-analysis!
We publish this indicator free on TradingView

XX engagements
