[GUEST ACCESS MODE: Data is scrambled or limited to provide examples. Make requests using your API key to unlock full data. Check https://lunarcrush.ai/auth for authentication information.]  Steve Jacobs [@SteveDJacobs](/creator/twitter/SteveDJacobs) on x 3570 followers Created: 2025-07-18 10:02:36 UTC Friday Watchlist 👀 XX Stocks Least extended $TMC $MDGL $NVT $CNTA $FOUR $SPHR $HROW $PLTR $SBLK $DXPE $TCBI $SHOP $VCTR $AGYS $AMBA $ZYME $PHVS $MARA $AAOI $SKYW $AMTM $ATAT $STEP $SPRY $CMPO $CLSK $MIR $OKLO $UI $AI $WULF $COCO $CALM $VRT $EVCM $SOUN $SLNO $AUPH $FSUN $HIMX $ANIP $BFC $IMCR $ROAD $ELVN $LLYVK $GENI $TWLO $ATRO $CHEF Criteria: Market Cap $1B+ Price >= EMA10 >= SMA20 >= SMA50 >= SMA200 ATR-to-SMA50 = X to 4.58x (in the "buyable" zone) ATR RS >=50 (i.e. above average) Reward-to-Risk 2.5+ Industry green color means it is in the top XX% while yellow color means the industry RS is 80+ on a weekly and/or monthly basis The stocks are visualized as an "ATR Matrix", with the concept explained in quoted post. 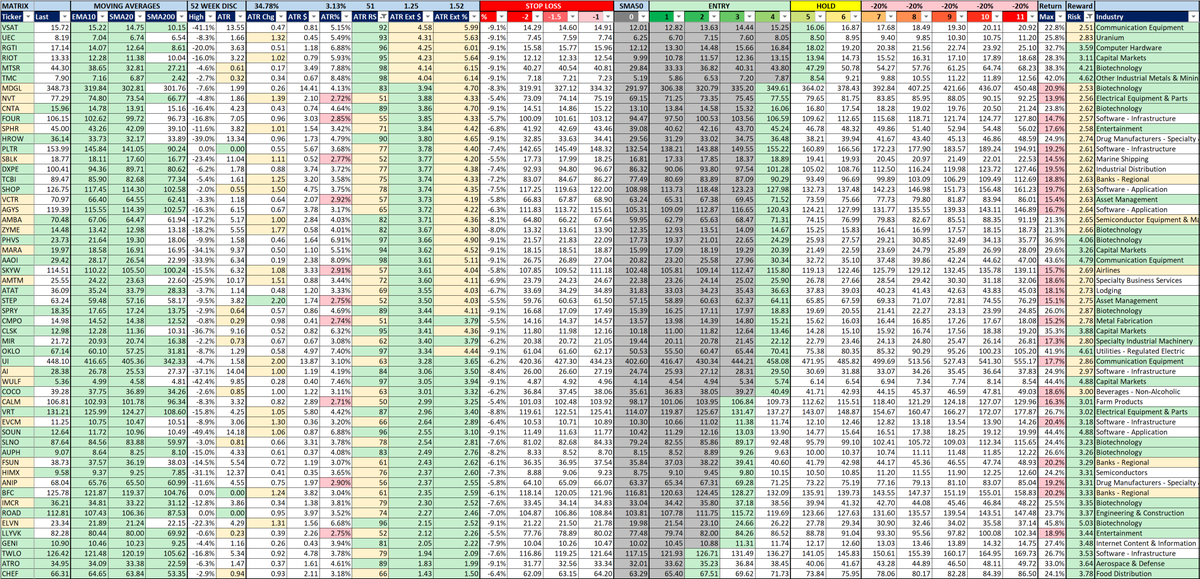 XXXXX engagements  **Related Topics** [market cap](/topic/market-cap) [coins ai](/topic/coins-ai) [mir](/topic/mir) [pltr](/topic/pltr) [nvt](/topic/nvt) [$1b](/topic/$1b) [$chef](/topic/$chef) [$geni](/topic/$geni) [Post Link](https://x.com/SteveDJacobs/status/1946148590457377076)
[GUEST ACCESS MODE: Data is scrambled or limited to provide examples. Make requests using your API key to unlock full data. Check https://lunarcrush.ai/auth for authentication information.]
 Steve Jacobs @SteveDJacobs on x 3570 followers
Created: 2025-07-18 10:02:36 UTC
Steve Jacobs @SteveDJacobs on x 3570 followers
Created: 2025-07-18 10:02:36 UTC
Friday Watchlist 👀 XX Stocks
Least extended $TMC $MDGL $NVT $CNTA $FOUR $SPHR $HROW $PLTR $SBLK $DXPE $TCBI $SHOP $VCTR $AGYS $AMBA $ZYME $PHVS $MARA $AAOI $SKYW $AMTM $ATAT $STEP $SPRY $CMPO $CLSK $MIR $OKLO $UI $AI $WULF $COCO $CALM $VRT $EVCM $SOUN $SLNO $AUPH $FSUN $HIMX $ANIP $BFC $IMCR $ROAD $ELVN $LLYVK $GENI $TWLO $ATRO $CHEF
Criteria: Market Cap $1B+ Price >= EMA10 >= SMA20 >= SMA50 >= SMA200 ATR-to-SMA50 = X to 4.58x (in the "buyable" zone) ATR RS >=50 (i.e. above average) Reward-to-Risk 2.5+
Industry green color means it is in the top XX% while yellow color means the industry RS is 80+ on a weekly and/or monthly basis
The stocks are visualized as an "ATR Matrix", with the concept explained in quoted post.

XXXXX engagements

Related Topics market cap coins ai mir pltr nvt $1b $chef $geni