[GUEST ACCESS MODE: Data is scrambled or limited to provide examples. Make requests using your API key to unlock full data. Check https://lunarcrush.ai/auth for authentication information.]  Steve Jacobs [@SteveDJacobs](/creator/twitter/SteveDJacobs) on x 3563 followers Created: 2025-07-16 21:49:59 UTC Thursday Watchlist 👀 XX Stocks (non-extended) $AGIO $KEP $TAC $LITE $NG $GEV $LAZ $FIVE $LGND $GHRS $STRL $ACMR $HCM $MTSR $COHR $MLTX $ASO $YOU $SMCI $SRRK $RMBS $LIF $MYRG $SMR $TMC $EVEX $IESC $SMTC $MSTR $RIOT $CNTA $HUT $FIX $CECO $PLTR $PHVS $CLSK $OKLO $NUVL $MIR $MRUS $CVNA $SHOP $NU $CALM $CIEN $IMCR $UI $QBTS $LLYVK Criteria: Market Cap $1B+ Price >= EMA10 >= SMA20 >= SMA50 Price >= SMA200 ATR-to-SMA50 = X to 4x (in the "buyable" zone) ATR RS >=50 (i.e. above average) Reward-to-Risk 2.5+ Industry green color means it is in the top XX% while yellow color means the industry RS is 80+ on a weekly and/or monthly basis The stocks are visualized as an "ATR Matrix", with the concept explained in quoted post. 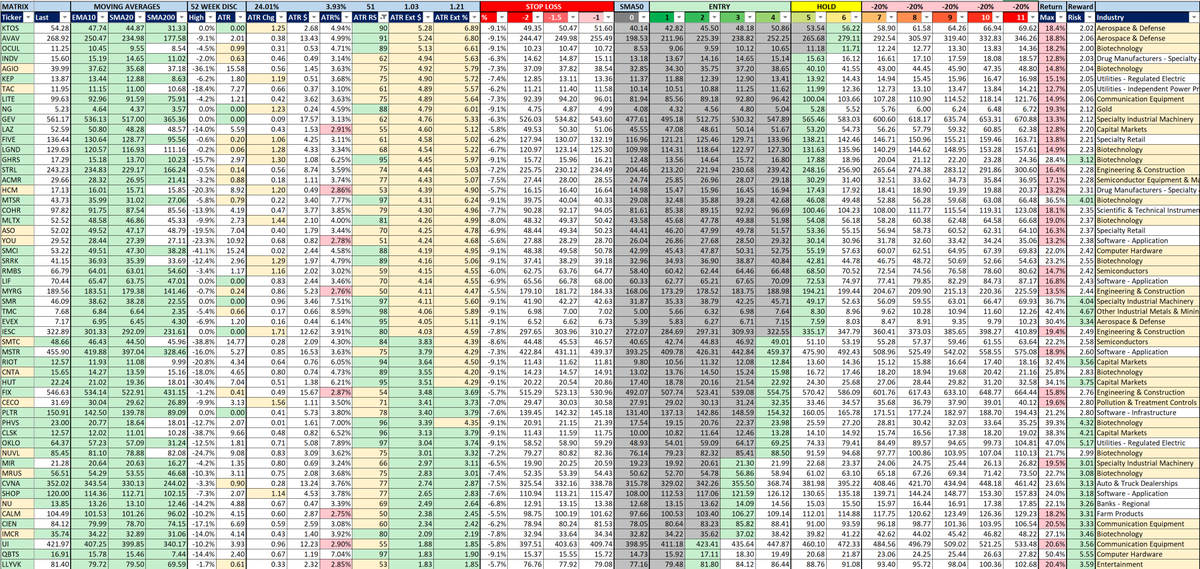 XXXXX engagements  **Related Topics** [matrix](/topic/matrix) [atr](/topic/atr) [$1b](/topic/$1b) [market cap](/topic/market-cap) [$imcr](/topic/$imcr) [$nu](/topic/$nu) [$phvs](/topic/$phvs) [$ceco](/topic/$ceco) [Post Link](https://x.com/SteveDJacobs/status/1945601833134674349)
[GUEST ACCESS MODE: Data is scrambled or limited to provide examples. Make requests using your API key to unlock full data. Check https://lunarcrush.ai/auth for authentication information.]
 Steve Jacobs @SteveDJacobs on x 3563 followers
Created: 2025-07-16 21:49:59 UTC
Steve Jacobs @SteveDJacobs on x 3563 followers
Created: 2025-07-16 21:49:59 UTC
Thursday Watchlist 👀
XX Stocks (non-extended) $AGIO $KEP $TAC $LITE $NG $GEV $LAZ $FIVE $LGND $GHRS $STRL $ACMR $HCM $MTSR $COHR $MLTX $ASO $YOU $SMCI $SRRK $RMBS $LIF $MYRG $SMR $TMC $EVEX $IESC $SMTC $MSTR $RIOT $CNTA $HUT $FIX $CECO $PLTR $PHVS $CLSK $OKLO $NUVL $MIR $MRUS $CVNA $SHOP $NU $CALM $CIEN $IMCR $UI $QBTS $LLYVK
Criteria: Market Cap $1B+ Price >= EMA10 >= SMA20 >= SMA50 Price >= SMA200 ATR-to-SMA50 = X to 4x (in the "buyable" zone) ATR RS >=50 (i.e. above average) Reward-to-Risk 2.5+
Industry green color means it is in the top XX% while yellow color means the industry RS is 80+ on a weekly and/or monthly basis
The stocks are visualized as an "ATR Matrix", with the concept explained in quoted post.

XXXXX engagements

Related Topics matrix atr $1b market cap $imcr $nu $phvs $ceco