[GUEST ACCESS MODE: Data is scrambled or limited to provide examples. Make requests using your API key to unlock full data. Check https://lunarcrush.ai/auth for authentication information.]  Martin Lewis [@MartinSLewis](/creator/twitter/MartinSLewis) on x 3.2M followers Created: 2025-07-16 16:36:22 UTC I'm afraid, the October Energy Price Cap is now predicted to RISE a touch! Things had been looking better, but the improvement has now softened a little. Ofgem's energy Price Cap moves every three months. It fell X% on X July. The Cap dictates the rate 2/3 homes in Eng, Scot & Wales pay - all those who aren't on fixes or special deals. My table below shows today's new average predictions (from X big firms) and compares them to what was predicted in previous weeks. I've used Ofgem's supposed 'cost for someone with typical use' figures (which for July-Oct is £1,720/yr) as that's how the predictions come, though far more relevant for your bill is the % change prediction. The Cap moves mainly based on the average wholesale rates of a 3mth period, for Oct that is mid-May to mid-Aug, so we're now two-thirds of the way through, the predictions now are solidifying. So its looking pretty likely people on Capped tariffs will continue to pay roughly the same as they do now until the end of the year. After that the crystal ball is far less clear, but the mood music currently predicts it'll rise. Frankly the Price Cap is almost certainly a Pants Cap for most. The cheapest 1yr fixes are currently around XX% less than today's Price Cap, so it would take a huge drop in wholesale energy prices over the rest of this year before it wasn't worth locking in a cheap fix, compared to sticking on the price cap (full help to find your cheapest fix in 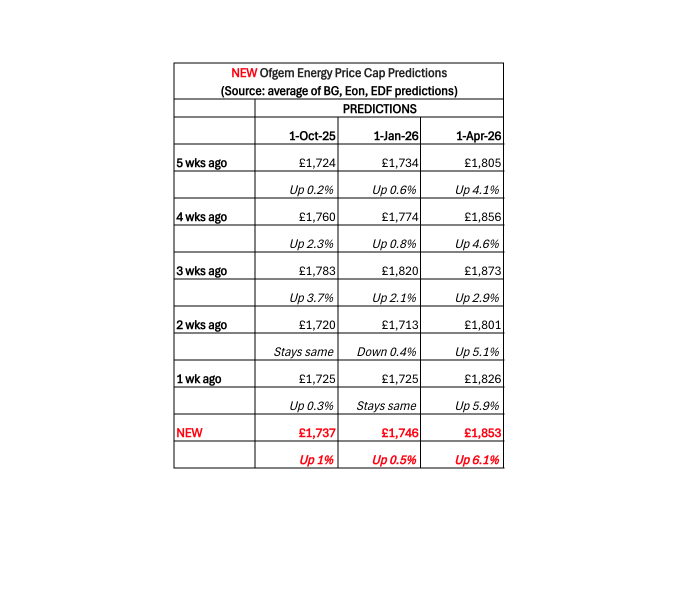 XXXXXXX engagements  **Related Topics** [homes](/topic/homes) [coins energy](/topic/coins-energy) [Post Link](https://x.com/MartinSLewis/status/1945522911990755467)
[GUEST ACCESS MODE: Data is scrambled or limited to provide examples. Make requests using your API key to unlock full data. Check https://lunarcrush.ai/auth for authentication information.]
 Martin Lewis @MartinSLewis on x 3.2M followers
Created: 2025-07-16 16:36:22 UTC
Martin Lewis @MartinSLewis on x 3.2M followers
Created: 2025-07-16 16:36:22 UTC
I'm afraid, the October Energy Price Cap is now predicted to RISE a touch! Things had been looking better, but the improvement has now softened a little.
Ofgem's energy Price Cap moves every three months. It fell X% on X July. The Cap dictates the rate 2/3 homes in Eng, Scot & Wales pay - all those who aren't on fixes or special deals.
My table below shows today's new average predictions (from X big firms) and compares them to what was predicted in previous weeks. I've used Ofgem's supposed 'cost for someone with typical use' figures (which for July-Oct is £1,720/yr) as that's how the predictions come, though far more relevant for your bill is the % change prediction.
The Cap moves mainly based on the average wholesale rates of a 3mth period, for Oct that is mid-May to mid-Aug, so we're now two-thirds of the way through, the predictions now are solidifying.
So its looking pretty likely people on Capped tariffs will continue to pay roughly the same as they do now until the end of the year. After that the crystal ball is far less clear, but the mood music currently predicts it'll rise.
Frankly the Price Cap is almost certainly a Pants Cap for most. The cheapest 1yr fixes are currently around XX% less than today's Price Cap, so it would take a huge drop in wholesale energy prices over the rest of this year before it wasn't worth locking in a cheap fix, compared to sticking on the price cap (full help to find your cheapest fix in

XXXXXXX engagements

Related Topics homes coins energy