[GUEST ACCESS MODE: Data is scrambled or limited to provide examples. Make requests using your API key to unlock full data. Check https://lunarcrush.ai/auth for authentication information.]  HeidingOut [@HeidingOut](/creator/twitter/HeidingOut) on x 7106 followers Created: 2025-07-14 23:21:22 UTC My $HIMS update. Think we saw a wave X in $HIMS around where my yellow arrow is. I believe the $XXXXX from Feb is actually the start of a new bullish cycle on the daily. On the monthly chart, you can see looks like the end of a wave X. Back to $HIMS daily, you see we made X waves up and had that huge draw down ending in April. To me, it's too lg to be a wave X. A wave X makes sense. Or, we are starting a bearish cycle. You see we had XX swings which is an impulse sequence that's since the ATLs. Next after Feb, we make X waves down, and then a X wave pattern up that give us our B wave on the daily at $XXXXX. We could actually go down further here. But, I suspect we've flipped $XXXXX into our new floor. If we go down, I'm thinking we could retest $XX as the low to complete a C wave. But, most likely we've completed the C. $HIMS flies in my mind. First target is $53.84, then $55.18, $XX will cause some heartbreak after $67.37, $XXXXX. Long term I see $80's into $XXX. But, I will be monitoring the number of sequences to make sure it stays bullish. Third chart is short term $HIMS PA. Think of that purple box like our break out box. We need past it. It did break it today on daily and on 4HR so I"m hopeful it's up, up and away. The only thing has me still in a few $HIMS puts as a hedge is bc I haven't received a signal on my little green indicator, but it lags. But, dang if that monthly trend chart is not just pure 🔥. EW for me is just a very strong suggestion. Always let price action guide your trades. I'll flip on this $HIMS position in a heartbeat if PA tells me otherwise. I'm not afraid to be wrong and am often. Warning: I'm not trained well in EW but I do my own thing it works for me. NFA $HIMS $HIMZ. 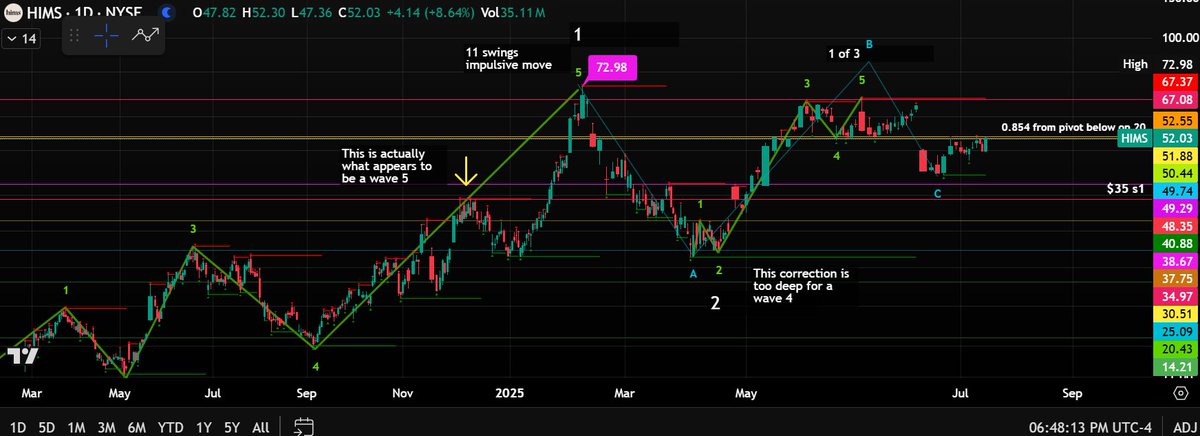 XXXXXX engagements  **Related Topics** [$003550ks](/topic/$003550ks) [lg](/topic/lg) [$hims](/topic/$hims) [hims hers](/topic/hims-hers) [stocks consumer defensive](/topic/stocks-consumer-defensive) [Post Link](https://x.com/HeidingOut/status/1944900054025740683)
[GUEST ACCESS MODE: Data is scrambled or limited to provide examples. Make requests using your API key to unlock full data. Check https://lunarcrush.ai/auth for authentication information.]
 HeidingOut @HeidingOut on x 7106 followers
Created: 2025-07-14 23:21:22 UTC
HeidingOut @HeidingOut on x 7106 followers
Created: 2025-07-14 23:21:22 UTC
My $HIMS update. Think we saw a wave X in $HIMS around where my yellow arrow is. I believe the $XXXXX from Feb is actually the start of a new bullish cycle on the daily. On the monthly chart, you can see looks like the end of a wave X. Back to $HIMS daily, you see we made X waves up and had that huge draw down ending in April. To me, it's too lg to be a wave X. A wave X makes sense. Or, we are starting a bearish cycle. You see we had XX swings which is an impulse sequence that's since the ATLs. Next after Feb, we make X waves down, and then a X wave pattern up that give us our B wave on the daily at $XXXXX. We could actually go down further here. But, I suspect we've flipped $XXXXX into our new floor. If we go down, I'm thinking we could retest $XX as the low to complete a C wave. But, most likely we've completed the C. $HIMS flies in my mind. First target is $53.84, then $55.18, $XX will cause some heartbreak after $67.37, $XXXXX. Long term I see $80's into $XXX. But, I will be monitoring the number of sequences to make sure it stays bullish.
Third chart is short term $HIMS PA. Think of that purple box like our break out box. We need past it. It did break it today on daily and on 4HR so I"m hopeful it's up, up and away. The only thing has me still in a few $HIMS puts as a hedge is bc I haven't received a signal on my little green indicator, but it lags. But, dang if that monthly trend chart is not just pure 🔥.
EW for me is just a very strong suggestion. Always let price action guide your trades. I'll flip on this $HIMS position in a heartbeat if PA tells me otherwise. I'm not afraid to be wrong and am often. Warning: I'm not trained well in EW but I do my own thing it works for me. NFA $HIMS $HIMZ.

XXXXXX engagements

Related Topics $003550ks lg $hims hims hers stocks consumer defensive