[GUEST ACCESS MODE: Data is scrambled or limited to provide examples. Make requests using your API key to unlock full data. Check https://lunarcrush.ai/auth for authentication information.]  Steve Jacobs [@SteveDJacobs](/creator/twitter/SteveDJacobs) on x 3429 followers Created: 2025-07-12 17:24:26 UTC Building Your Own "Trading Workbook" I think most people who trade would benefit from building their own “Trading Workbook”, however simple or complex, to “automate the repetitive (boring! ) stuff”. If you like what I share in my posts on X and it gives you some ideas, or you just want to copy it directly, then I encourage and champion you to do so! 🤝 @jfsrevg has some amazing posts on creating dashboards and @Clement_Ang17 has a beautiful "Daily Market Plan" worksheet that he shares in his posts on X. Hopefully, on your journey, you might come up with some fresh ideas for your "Trading Workbook" and others in turn will be “inspired” to build those ideas into their processes and systems (this includes me). I will try to write a “How to build a Trading Workbook - 1st Steps” post this week but in the meantime I will try to answer your questions now. The workbook I use is simply MS Excel. No fancy plug-ins, macros, APIs, just “out-of-the box” Excel using the standard features available. I recommend strongly having your source data separate from your calculated data. This makes it easier to manage and develop. Personally, I have X “input” worksheets (see screenshot): Input Worksheet X - Finviz Extract This worksheet is where I paste (using paste special) the abbreviated data downloaded from @FINVIZ_com . I use the link below (except with a $1B+ threshold rather than $2B as you need Elite to use $1B) During market hours, I download the CSV file multiple times throughout the session from @FINVIZ_com and paste it directly into this worksheet to update the data in (almost) real-time for the $1B+ stock universe (around 2400 stocks). It takes a few seconds. Input Worksheet X - Python Extract This worksheet stores the calculated non-intraday data. I take a full @FINVIZ_com download of all data using this link: With the extract downloaded, I run the Python code around 6/7am GMT and it takes around XX minutes, calculating Key Moving Averages, obtaining analyst Revenue/EPS estimates from other websites etc . Basically, generating a data file that doesn't need to be refreshed intraday. This is why when I post, sometimes I add "(EOD)" because I have not refreshed all the Python data compared to if I post premarket. Input Worksheet X - Portfolio The current holdings are extracted from the brokerage account(s) and pasted directly into this worksheet. If I buy or sell, I will re-extract and paste throughout the day. Having the current portfolio positions helps me know what I want to buy/add/reduce/sell and how much based on reward-risk. For example, if I have $AG as a core position, I will not want to add $PAAS due to overlap. Alternatively, the core positon could be XX% of each as they are the same industry (Silver). All other analysis and the posts shared on X are derivatives from these three worksheets using “out-of-the-box” Excel. This includes: - ATR Matrix (including my personal watchlist) - Scans (O’Neil, Qullamaggie, Minervini) - Relative Trend Strength Matrix - Darvas Heatmap - Stage Analysis - Industry & Sector Analysis - Liquid Leaders Most Importantly - save regularly (as new files) and keep backups! I recommend creating a new version/copy everyday prefixed with today's date (format YYMMDD). This then becomes a great archive if you want to look back historically at snapshots, perform trade analysis and build "Modelbooks". Hope this helps! Best of luck and have a great weekend🍀 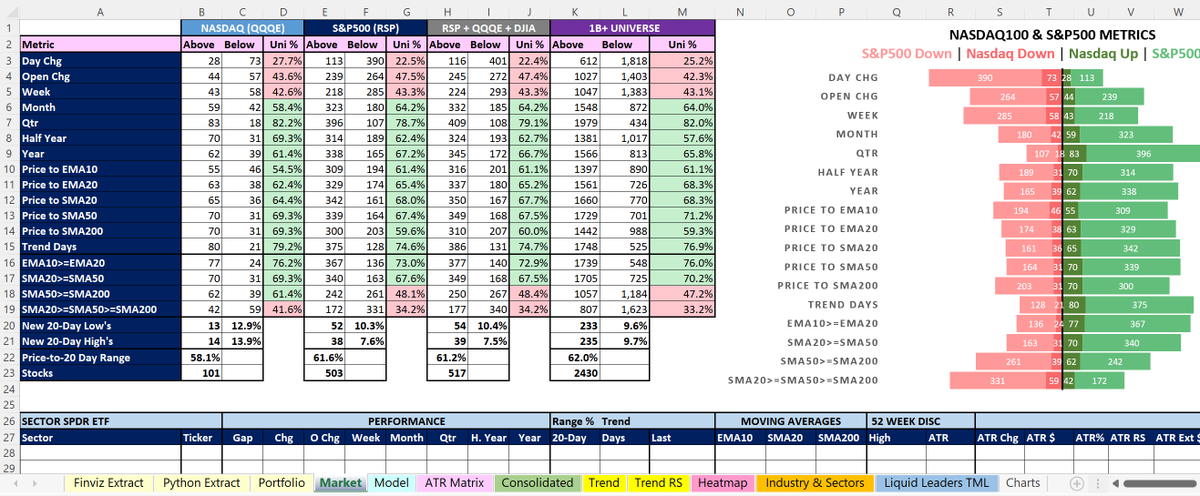 XXXXXX engagements  **Related Topics** [$reymi](/topic/$reymi) [Post Link](https://x.com/SteveDJacobs/status/1944085456603500627)
[GUEST ACCESS MODE: Data is scrambled or limited to provide examples. Make requests using your API key to unlock full data. Check https://lunarcrush.ai/auth for authentication information.]
 Steve Jacobs @SteveDJacobs on x 3429 followers
Created: 2025-07-12 17:24:26 UTC
Steve Jacobs @SteveDJacobs on x 3429 followers
Created: 2025-07-12 17:24:26 UTC
Building Your Own "Trading Workbook"
I think most people who trade would benefit from building their own “Trading Workbook”, however simple or complex, to “automate the repetitive (boring! ) stuff”.
If you like what I share in my posts on X and it gives you some ideas, or you just want to copy it directly, then I encourage and champion you to do so! 🤝 @jfsrevg has some amazing posts on creating dashboards and @Clement_Ang17 has a beautiful "Daily Market Plan" worksheet that he shares in his posts on X.
Hopefully, on your journey, you might come up with some fresh ideas for your "Trading Workbook" and others in turn will be “inspired” to build those ideas into their processes and systems (this includes me).
I will try to write a “How to build a Trading Workbook - 1st Steps” post this week but in the meantime I will try to answer your questions now.
The workbook I use is simply MS Excel. No fancy plug-ins, macros, APIs, just “out-of-the box” Excel using the standard features available.
I recommend strongly having your source data separate from your calculated data. This makes it easier to manage and develop. Personally, I have X “input” worksheets (see screenshot):
Input Worksheet X - Finviz Extract This worksheet is where I paste (using paste special) the abbreviated data downloaded from @FINVIZ_com . I use the link below (except with a $1B+ threshold rather than $2B as you need Elite to use $1B)
During market hours, I download the CSV file multiple times throughout the session from @FINVIZ_com and paste it directly into this worksheet to update the data in (almost) real-time for the $1B+ stock universe (around 2400 stocks). It takes a few seconds.
Input Worksheet X - Python Extract This worksheet stores the calculated non-intraday data. I take a full @FINVIZ_com download of all data using this link:
With the extract downloaded, I run the Python code around 6/7am GMT and it takes around XX minutes, calculating Key Moving Averages, obtaining analyst Revenue/EPS estimates from other websites etc . Basically, generating a data file that doesn't need to be refreshed intraday. This is why when I post, sometimes I add "(EOD)" because I have not refreshed all the Python data compared to if I post premarket.
Input Worksheet X - Portfolio The current holdings are extracted from the brokerage account(s) and pasted directly into this worksheet. If I buy or sell, I will re-extract and paste throughout the day. Having the current portfolio positions helps me know what I want to buy/add/reduce/sell and how much based on reward-risk. For example, if I have $AG as a core position, I will not want to add $PAAS due to overlap. Alternatively, the core positon could be XX% of each as they are the same industry (Silver).
All other analysis and the posts shared on X are derivatives from these three worksheets using “out-of-the-box” Excel. This includes:
- ATR Matrix (including my personal watchlist)
- Scans (O’Neil, Qullamaggie, Minervini)
- Relative Trend Strength Matrix
- Darvas Heatmap
- Stage Analysis
- Industry & Sector Analysis
- Liquid Leaders
Most Importantly - save regularly (as new files) and keep backups! I recommend creating a new version/copy everyday prefixed with today's date (format YYMMDD). This then becomes a great archive if you want to look back historically at snapshots, perform trade analysis and build "Modelbooks".
Hope this helps! Best of luck and have a great weekend🍀

XXXXXX engagements

Related Topics $reymi