[GUEST ACCESS MODE: Data is scrambled or limited to provide examples. Make requests using your API key to unlock full data. Check https://lunarcrush.ai/auth for authentication information.]  Dividendology [@dividendology](/creator/twitter/dividendology) on x 80.7K followers Created: 2025-07-05 16:20:29 UTC Is it possible for a REIT that has a total return of over XX% over the last year to still be undervalued? The answer is absolutely yes. This chart shows how cheap U.S. REITs are relative to the S&P XXX based on earnings multiples. The blue line = REITs vs. equities multiple spread The purple line = 20-year median Right now, REITs are trading at a -3.8x spread (one of the deepest discounts in XX years) Historically, when REITs have traded at a -2.0x discount or more, they’ve delivered returns that outperform the S&P XXX. On top of this, REITs have a short term catalyst on the horizon. With rates coming down, the high yielding REITs become more attractive to income investors. So why $VICI? To start, the REIT has great dividend metrics: - Current dividend yield: ~5.3% - 5-year dividend CAGR: ~6.4% - Dividend growth every year since 2018 (even during 2020) That’s rare for a REIT and speaks to the strength of VICI’s tenant base. In their most recent earnings report in April, FFO came in at $0.58, missing expectations by $XXXX. At first glance, that looks bad, but the miss was driven by a non-cash accounting adjustment due to CECL (loan loss reserves). It didn’t reflect real business deterioration. In fact: - Adjusted FFO rose XXX% - AFFO per share rose XXX% - Moody’s upgraded their credit rating - 2025 guidance was increased One of the biggest threats (particularly for REITs) is inflation. However, $VICI investors don’t have to be concerned with this. - XX% of rent is CPI-linked today - Expected to be XX% by 2035 This helps protect purchasing power and supports sustainable dividend growth. $VICI also has built one of the better balance sheets in the REIT sector, and that matters, especially in a high-rate environment. - XX% of debt is fixed-rate: This shields them from rising interest costs and locks in lower rates from previous years. - XX% of debt is unsecured: No specific properties are pledged as collateral, giving them more flexibility to raise capital or refinance. - XXX years average maturity: Debt is spread out over time, with no near-term pressure to refinance. - Staggered maturity ladder: Debt is evenly spaced over future years, reducing risk during tighter credit conditions. As for the valuation, if we run $VICI through a dividend discount model assuming XXXX% dividend growth, we come to a fair value of $XXXXX. This gives $VICI XX% upside. 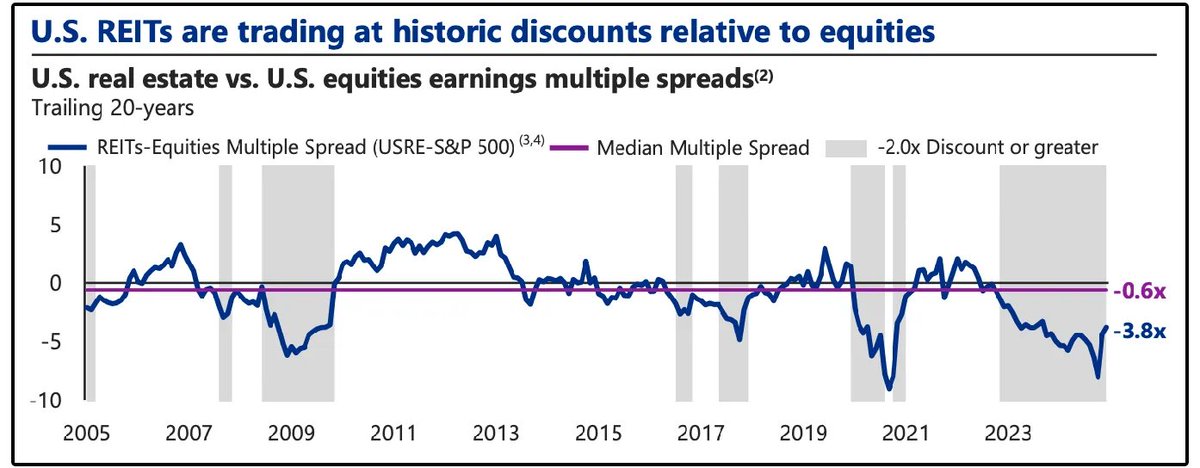 XXXXX engagements  **Related Topics** [stocks](/topic/stocks) [rating agency](/topic/rating-agency) [reit](/topic/reit) [$spy](/topic/$spy) [Post Link](https://x.com/dividendology/status/1941532645076193552)
[GUEST ACCESS MODE: Data is scrambled or limited to provide examples. Make requests using your API key to unlock full data. Check https://lunarcrush.ai/auth for authentication information.]
 Dividendology @dividendology on x 80.7K followers
Created: 2025-07-05 16:20:29 UTC
Dividendology @dividendology on x 80.7K followers
Created: 2025-07-05 16:20:29 UTC
Is it possible for a REIT that has a total return of over XX% over the last year to still be undervalued?
The answer is absolutely yes.
This chart shows how cheap U.S. REITs are relative to the S&P XXX based on earnings multiples.
The blue line = REITs vs. equities multiple spread The purple line = 20-year median
Right now, REITs are trading at a -3.8x spread (one of the deepest discounts in XX years)
Historically, when REITs have traded at a -2.0x discount or more, they’ve delivered returns that outperform the S&P XXX.
On top of this, REITs have a short term catalyst on the horizon.
With rates coming down, the high yielding REITs become more attractive to income investors.
So why $VICI?
To start, the REIT has great dividend metrics:
- Current dividend yield: ~5.3%
- 5-year dividend CAGR: ~6.4%
- Dividend growth every year since 2018 (even during 2020)
That’s rare for a REIT and speaks to the strength of VICI’s tenant base.
In their most recent earnings report in April, FFO came in at $0.58, missing expectations by $XXXX.
At first glance, that looks bad, but the miss was driven by a non-cash accounting adjustment due to CECL (loan loss reserves). It didn’t reflect real business deterioration.
In fact:
- Adjusted FFO rose XXX%
- AFFO per share rose XXX%
- Moody’s upgraded their credit rating
- 2025 guidance was increased
One of the biggest threats (particularly for REITs) is inflation.
However, $VICI investors don’t have to be concerned with this.
- XX% of rent is CPI-linked today
- Expected to be XX% by 2035
This helps protect purchasing power and supports sustainable dividend growth.
$VICI also has built one of the better balance sheets in the REIT sector, and that matters, especially in a high-rate environment.
XX% of debt is fixed-rate: This shields them from rising interest costs and locks in lower rates from previous years.
XX% of debt is unsecured: No specific properties are pledged as collateral, giving them more flexibility to raise capital or refinance.
XXX years average maturity: Debt is spread out over time, with no near-term pressure to refinance.
Staggered maturity ladder: Debt is evenly spaced over future years, reducing risk during tighter credit conditions.
As for the valuation, if we run $VICI through a dividend discount model assuming XXXX% dividend growth, we come to a fair value of $XXXXX.
This gives $VICI XX% upside.

XXXXX engagements

Related Topics stocks rating agency reit $spy