[GUEST ACCESS MODE: Data is scrambled or limited to provide examples. Make requests using your API key to unlock full data. Check https://lunarcrush.ai/auth for authentication information.]
 #OTCSET Guy @ChartDiligence on x 2095 followers
Created: 2025-06-18 16:00:41 UTC
#OTCSET Guy @ChartDiligence on x 2095 followers
Created: 2025-06-18 16:00:41 UTC
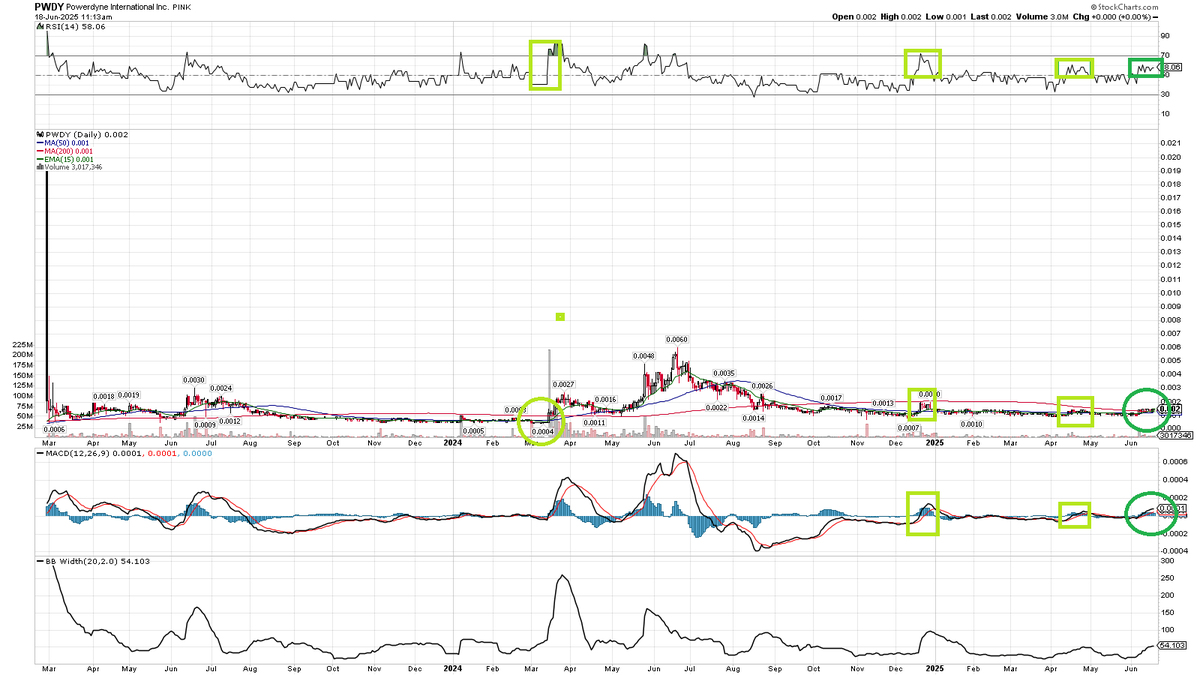
$PWDY I believe is repeating the setup from last year begin triggered in March, but it's also objectively stronger of a setup.
Price action: When the setup triggered in March 2024, it began when the price was stuck underneath it's daily chart moving averages. The short term MAs were below the longer term MAs. That's a starting point of weakness and it took a few weeks of strength for those MAs to flip (50 crossed above the 200).
RSI: A strong stock will have a high RSI, but if it (the RSI) goes up too fast too quick, it largely indicates the stock will have a hard time holding said gains. In a perfect world a breakout will push through the RSI XX level which tends to be a key level, but it does so first with a long warmup phase in the XX - XX range first. That warming up tends to be important. Now look at the March trigger's RSI and see how it went straight from XX all the way through the XX level, which was too much too soon. The best breakouts tend to have significant warm- up phases ABOVE RSI XX but below RSI XX. That's what we're seeing now and that's what the 2024 pop was missing.
MACD: In terms of the best setup for the MACD, I want to see the MACD lines coil up at the zero line. The best price breakouts tend to occur when the MACD is trending above it's zero line, and a long tightening phase at the zero line is a great precursor to a bullish uptrend.
I think objectively this is the strongest $PWDY has ever seen it's daily chart. This is the first setup where you have all of the elements it needs to indicate a mature breakout setup is setting up. The RSI has been basing in the XX - XX level (twice in the last X months) and is probably ready to warm up to the XX - XX range, the MACD has coiled at the zero line and is angling up into positive territory, and most important is the price action is holding above it's pinching moving averages.
March 2024 needed a big candle and huge volume to blast through the XXX but this time we're starting above it, so no blasting necessary to take out the wall. The XX MA is ever so slightly below the 200, so we're getting our golden cross almost immediately.
It's sneakily strong and that's not even looking even further back than the chart I posted, which includes just the trading since it got relisted after a lengthy delisted phase. This post 2023 trading is entirely above the pre-delisted stage, so quietly but surely it's been forming higher highs and higher lows literally throughout it's entire trading history. I don't know if I've ever seen an OTC do that for this long. I don't think there's a chance in hell an OTC could trade like this for this long, without something meaningfully positive occurring behind the scenes.
No debt, right sector, right time, funding approved for more acquisitions, and the chart I believe tells us these guys have been and continue to do things the right way, slow, steady and consistent. #OTCSET
#OTCSET
XXXXX engagements
