[GUEST ACCESS MODE: Data is scrambled or limited to provide examples. Make requests using your API key to unlock full data. Check https://lunarcrush.ai/auth for authentication information.]  🔋Greg🔋💎🤲 [@FreemyerGreg](/creator/twitter/FreemyerGreg) on x 1043 followers Created: 2025-07-26 08:54:04 UTC $eose My best guess ==== Q2 was the inflection point per my calculations: First, $eose embeds line commissioning and ramp costs in COGS. I don't know what normal is, but it drastically distorts the P&L. The below isn't a P&L discussion. It uses COGS as described in the below slide: Q1 COGS: ~$270/KWh - 45X ~$225/KWh Avg selling price $200/KWh Q2 COGS at exit: ~$50 lower due to 3x volume increase alone spreading out manufacturing overhead. Reduced labor costs not hitting until Q3. ~$175/KWh Average selling price close to $250/KWh - ~$75/KWh gross profit (again, not reflected on P&L) Q3 COGS at exit: volume double Q3, sub-assembly automation fully in place ~$122.50/KWh === City Utilities had a sales price of $338/KWh. (216 MWh for $73mm) === Joe/Nathan are going to rock our world Thursday! 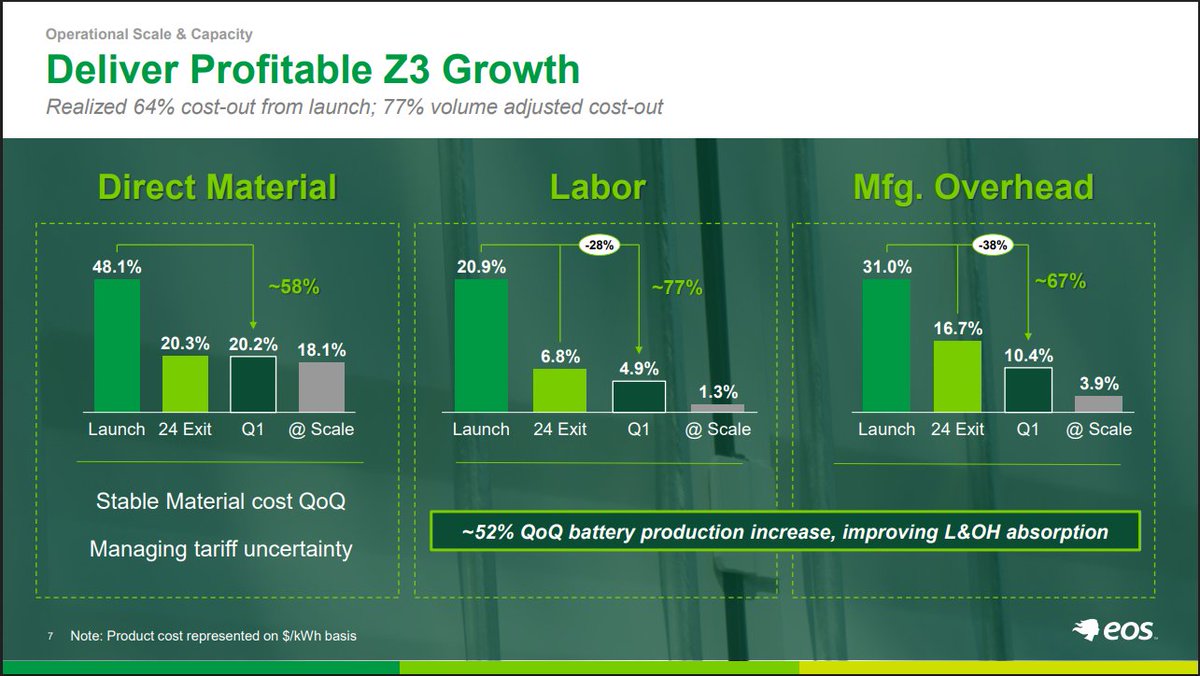 XXXXX engagements  **Related Topics** [$200kwh](/topic/$200kwh) [avg](/topic/avg) [$225kwh](/topic/$225kwh) [$270kwh](/topic/$270kwh) [balance sheet](/topic/balance-sheet) [greg](/topic/greg) [$eose](/topic/$eose) [stocks energy](/topic/stocks-energy) [Post Link](https://x.com/FreemyerGreg/status/1949030447796691070)
[GUEST ACCESS MODE: Data is scrambled or limited to provide examples. Make requests using your API key to unlock full data. Check https://lunarcrush.ai/auth for authentication information.]
 🔋Greg🔋💎🤲 @FreemyerGreg on x 1043 followers
Created: 2025-07-26 08:54:04 UTC
🔋Greg🔋💎🤲 @FreemyerGreg on x 1043 followers
Created: 2025-07-26 08:54:04 UTC
$eose My best guess
Q2 was the inflection point per my calculations:
First, $eose embeds line commissioning and ramp costs in COGS. I don't know what normal is, but it drastically distorts the P&L.
The below isn't a P&L discussion. It uses COGS as described in the below slide:
Q1 COGS: ~$270/KWh - 45X ~$225/KWh
Avg selling price $200/KWh
Q2 COGS at exit: ~$50 lower due to 3x volume increase alone spreading out manufacturing overhead. Reduced labor costs not hitting until Q3.
~$175/KWh
Average selling price close to $250/KWh - ~$75/KWh gross profit (again, not reflected on P&L)
Q3 COGS at exit: volume double Q3, sub-assembly automation fully in place
~$122.50/KWh
=== City Utilities had a sales price of $338/KWh. (216 MWh for $73mm)
=== Joe/Nathan are going to rock our world Thursday!

XXXXX engagements

Related Topics $200kwh avg $225kwh $270kwh balance sheet greg $eose stocks energy