[GUEST ACCESS MODE: Data is scrambled or limited to provide examples. Make requests using your API key to unlock full data. Check https://lunarcrush.ai/auth for authentication information.]  cexscan [@cexscan](/creator/twitter/cexscan) on x 4206 followers Created: 2025-07-25 19:15:48 UTC Technical Analysis: ATOM/USDT Executive Summary Cosmos (ATOM) is currently trading at approximately $4.59, showing a slight decrease over the last XX hours (-1.61%). The 30-day price change is positive at +13.40%. Technical indicators, as observed from the 30-minute chart, suggest a potential short-term downtrend. The RSI is hovering around 45, indicating a lack of strong momentum in either direction but leaning towards bearish sentiment as it is below XX. Moving averages (EMAs) show the shorter-term EMAs are below the longer-term ones, reinforcing the bearish trend. The trading volume is relatively low, with 11.78K shown on the chart. Full 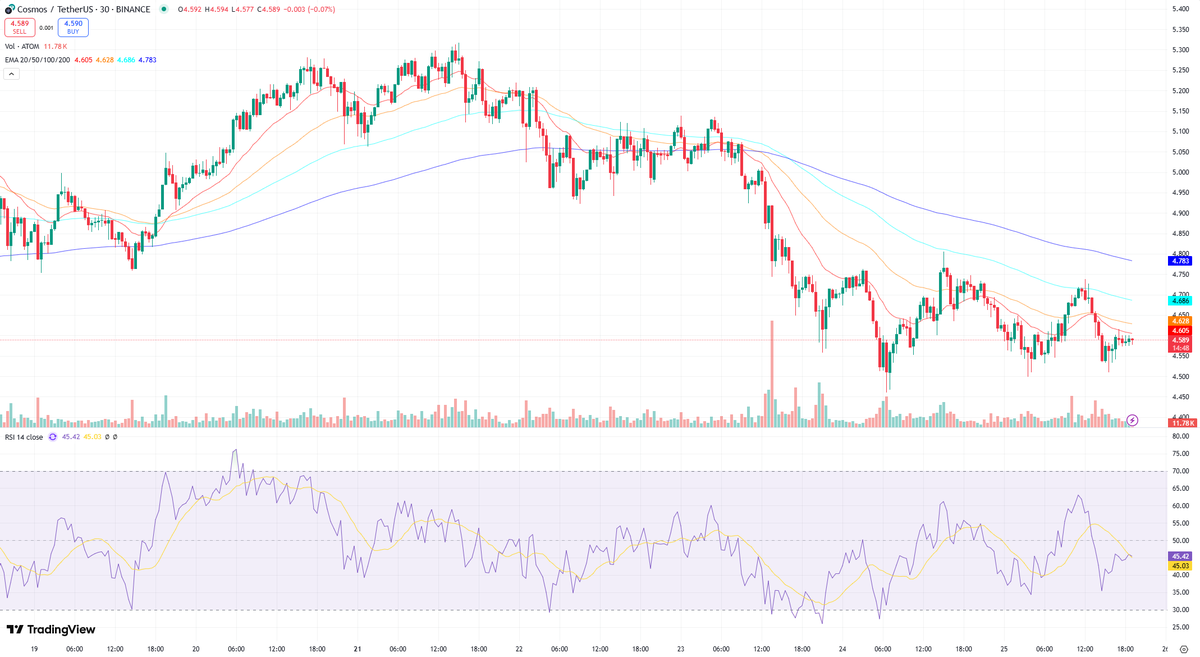 XX engagements  **Related Topics** [24 hours](/topic/24-hours) [momentum](/topic/momentum) [atom](/topic/atom) [cosmos](/topic/cosmos) [Post Link](https://x.com/cexscan/status/1948824523203121250)
[GUEST ACCESS MODE: Data is scrambled or limited to provide examples. Make requests using your API key to unlock full data. Check https://lunarcrush.ai/auth for authentication information.]
 cexscan @cexscan on x 4206 followers
Created: 2025-07-25 19:15:48 UTC
cexscan @cexscan on x 4206 followers
Created: 2025-07-25 19:15:48 UTC
Technical Analysis: ATOM/USDT Executive Summary
Cosmos (ATOM) is currently trading at approximately $4.59, showing a slight decrease over the last XX hours (-1.61%). The 30-day price change is positive at +13.40%. Technical indicators, as observed from the 30-minute chart, suggest a potential short-term downtrend. The RSI is hovering around 45, indicating a lack of strong momentum in either direction but leaning towards bearish sentiment as it is below XX. Moving averages (EMAs) show the shorter-term EMAs are below the longer-term ones, reinforcing the bearish trend. The trading volume is relatively low, with 11.78K shown on the chart.
Full

XX engagements
