[GUEST ACCESS MODE: Data is scrambled or limited to provide examples. Make requests using your API key to unlock full data. Check https://lunarcrush.ai/auth for authentication information.]  Econovis [@econovisuals](/creator/twitter/econovisuals) on x 6945 followers Created: 2025-07-25 13:10:00 UTC 📈 U.S. Manufacturing Profits Stabilize Around $XXX Billion Following Post-Pandemic Surge U.S. manufacturing corporate profits averaged $XXX billion (seasonally adjusted, annualized) from Q2 2022 to Q1 2025. This follows a sharp rebound: after declining XX% between 2012 and 2019 (–1.9% CAGR), profits surged XX% from 2019 to Q4 2024 (14.2% CAGR), reaching a peak of $XXX billion. Inflation averaged just XXX% annually during the 2012–2019 period, compared to XXX% from 2019 onward. Adjusted for inflation, real manufacturing profit growth shifted from –3.3% per year before 2019 to XXX% annually after 2019. #US #economy #corporate #manufacturing #profit #business #stocks #SPX #investing 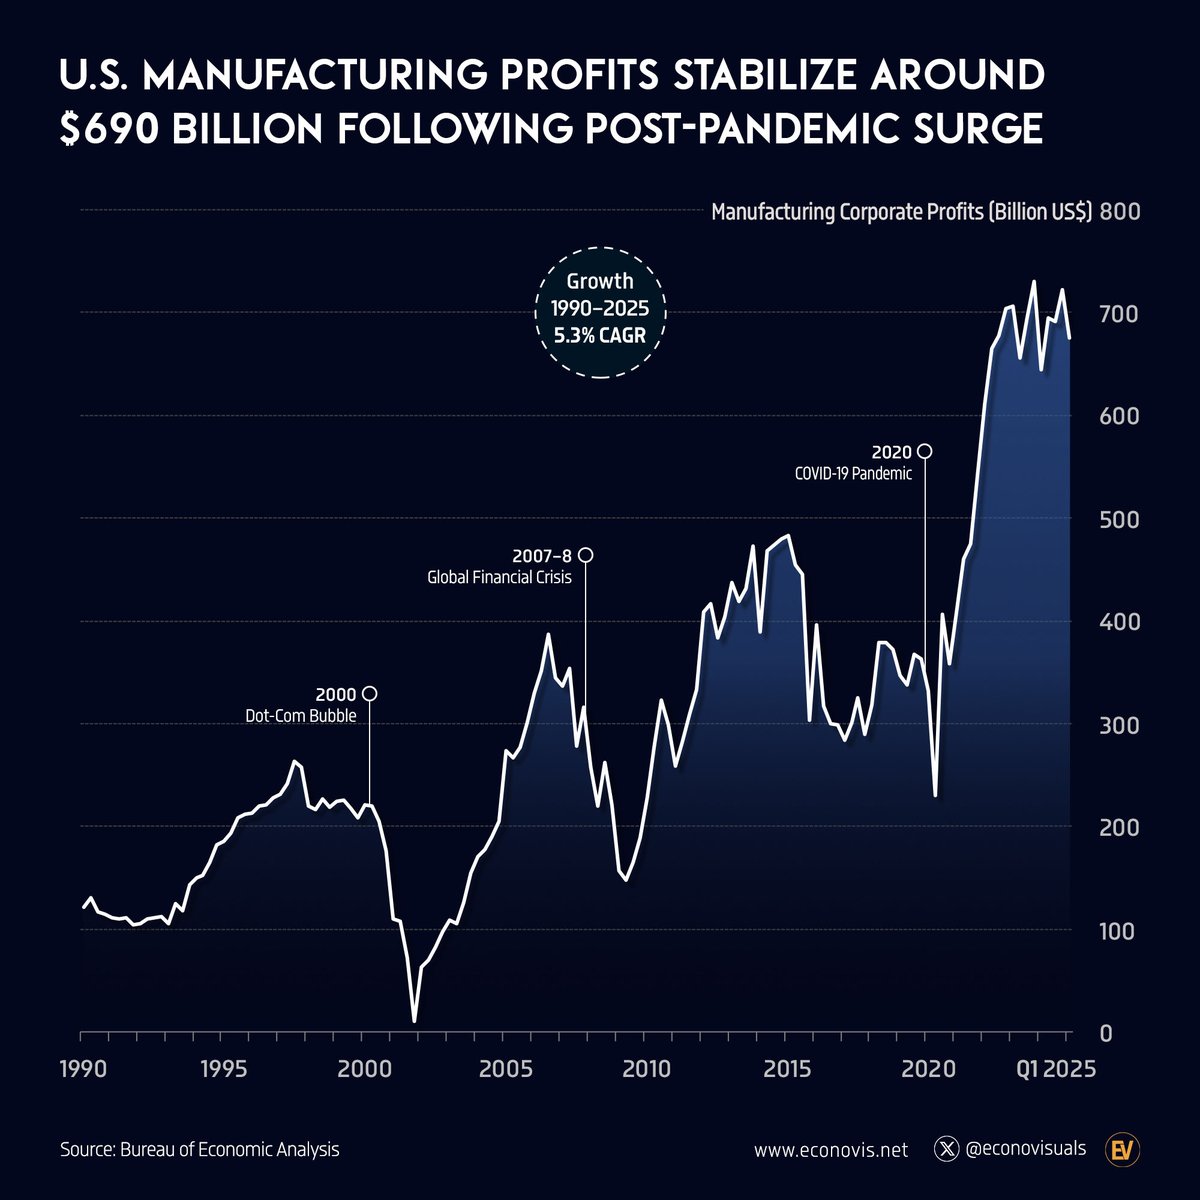 XXX engagements  **Related Topics** [inflation](/topic/inflation) [$6753t](/topic/$6753t) [surge](/topic/surge) [Post Link](https://x.com/econovisuals/status/1948732467244102007)
[GUEST ACCESS MODE: Data is scrambled or limited to provide examples. Make requests using your API key to unlock full data. Check https://lunarcrush.ai/auth for authentication information.]
 Econovis @econovisuals on x 6945 followers
Created: 2025-07-25 13:10:00 UTC
Econovis @econovisuals on x 6945 followers
Created: 2025-07-25 13:10:00 UTC
📈 U.S. Manufacturing Profits Stabilize Around $XXX Billion Following Post-Pandemic Surge
U.S. manufacturing corporate profits averaged $XXX billion (seasonally adjusted, annualized) from Q2 2022 to Q1 2025. This follows a sharp rebound: after declining XX% between 2012 and 2019 (–1.9% CAGR), profits surged XX% from 2019 to Q4 2024 (14.2% CAGR), reaching a peak of $XXX billion. Inflation averaged just XXX% annually during the 2012–2019 period, compared to XXX% from 2019 onward. Adjusted for inflation, real manufacturing profit growth shifted from –3.3% per year before 2019 to XXX% annually after 2019.
#US #economy #corporate #manufacturing #profit #business #stocks #SPX #investing

XXX engagements
