[GUEST ACCESS MODE: Data is scrambled or limited to provide examples. Make requests using your API key to unlock full data. Check https://lunarcrush.ai/auth for authentication information.]  Blub🤖💥 [@Crypto_blub](/creator/twitter/Crypto_blub) on x 2492 followers Created: 2025-07-25 07:55:23 UTC GM $ANON We bounced nicely from Support at 2.40$ and are now testing the resistance at about 3$. Breakout or retest from this levels❓ Checkout chart analysis with HUD: What does HUD analyze in this chart? 🔎 The chart shows a price development with key support and resistance levels set at XXXXXX and 3.1621, respectively. The most recent price action moves from a sharp drop past the support, followed by a recovery that temporarily surpassed resistance, and then retreated slightly. Analysis: X. Trend: ➡️Downtrend: The visible segment starts with a consistent downtrend until a strong upward impulse overtakes previous resistance. ➡️Current Status: There's a sideways consolidation close to the mid-range between resistance and support. X. Volume: ➡️Spike During Reversal: Notable volume increases coincide with the upward reversal, validating the bounce back from lower levels. ➡️Volatility: Reduced after the immediate sharp moves, implying a potential range-bound action for now. X. Key Levels: ➡️Support @ 2.4000: Established and confirmed as the turnaround point for the recent bullish impulse. ➡️Resistance @ 3.1621: Surpassed during the initial aggressive recovery phase but is currently acting as a probable ceiling. Outlook: - Continuation or Reversal: The price situated between historical support and resistance suggests the possibility of range trading unless a breakout beyond current bounds occurs. - Scenarios to Watch: ➡️Bullish: Sustained moves beyond XXXXXX could signal a strong upward move. ➡️Bearish: A fall below XXXXXX could lead to a continuation of the downtrend. Considering these factors, closely monitoring price action and volume near established thresholds could provide better insight into near-term momentum and potential market moves. 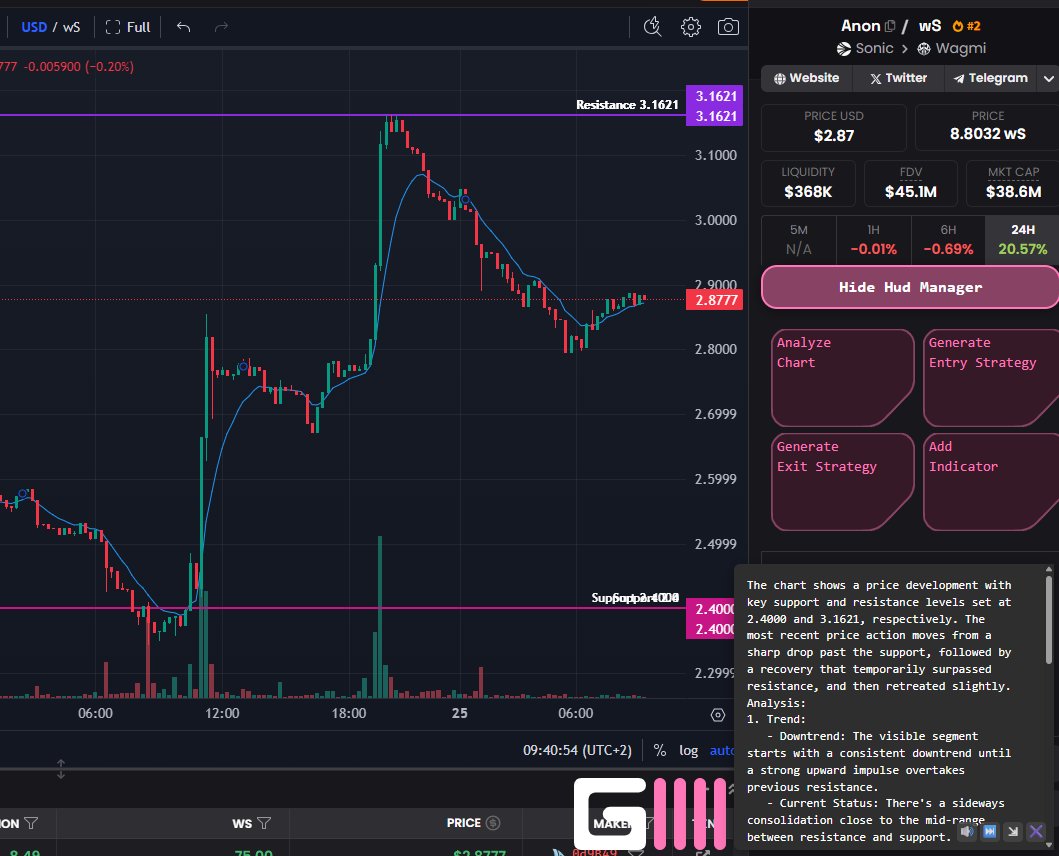 XXXXX engagements  **Related Topics** [Sentiment](/topic/sentiment) [accumulation](/topic/accumulation) [$6753t](/topic/$6753t) [hud](/topic/hud) [$anon](/topic/$anon) [sonic](/topic/sonic) [coins layer 1](/topic/coins-layer-1) [Post Link](https://x.com/Crypto_blub/status/1948653292130586861)
[GUEST ACCESS MODE: Data is scrambled or limited to provide examples. Make requests using your API key to unlock full data. Check https://lunarcrush.ai/auth for authentication information.]
 Blub🤖💥 @Crypto_blub on x 2492 followers
Created: 2025-07-25 07:55:23 UTC
Blub🤖💥 @Crypto_blub on x 2492 followers
Created: 2025-07-25 07:55:23 UTC
GM $ANON
We bounced nicely from Support at 2.40$ and are now testing the resistance at about 3$.
Breakout or retest from this levels❓
Checkout chart analysis with HUD:
What does HUD analyze in this chart? 🔎
The chart shows a price development with key support and resistance levels set at XXXXXX and 3.1621, respectively. The most recent price action moves from a sharp drop past the support, followed by a recovery that temporarily surpassed resistance, and then retreated slightly.
Analysis:
X. Trend:
➡️Downtrend: The visible segment starts with a consistent downtrend until a strong upward impulse overtakes previous resistance.
➡️Current Status: There's a sideways consolidation close to the mid-range between resistance and support.
X. Volume:
➡️Spike During Reversal: Notable volume increases coincide with the upward reversal, validating the bounce back from lower levels.
➡️Volatility: Reduced after the immediate sharp moves, implying a potential range-bound action for now.
X. Key Levels: ➡️Support @ 2.4000: Established and confirmed as the turnaround point for the recent bullish impulse. ➡️Resistance @ 3.1621: Surpassed during the initial aggressive recovery phase but is currently acting as a probable ceiling. Outlook: - Continuation or Reversal: The price situated between historical support and resistance suggests the possibility of range trading unless a breakout beyond current bounds occurs. - Scenarios to Watch: ➡️Bullish: Sustained moves beyond XXXXXX could signal a strong upward move. ➡️Bearish: A fall below XXXXXX could lead to a continuation of the downtrend. Considering these factors, closely monitoring price action and volume near established thresholds could provide better insight into near-term momentum and potential market moves.

XXXXX engagements

Related Topics Sentiment accumulation $6753t hud $anon sonic coins layer 1