[GUEST ACCESS MODE: Data is scrambled or limited to provide examples. Make requests using your API key to unlock full data. Check https://lunarcrush.ai/auth for authentication information.]  Kurtis The Quant [@Quant_Kurtis](/creator/twitter/Quant_Kurtis) on x 4480 followers Created: 2025-07-23 15:44:08 UTC How does stock-based compensation affect share price returns? The results over the past XX years are conflicting. The latest release of this Portfolio123 factor (based on FactSet data) is as follows: ✔️ stock-based compensation TTM (income statement) / EV I ran a factor backtest from 2010 with this factor in the S&P XXX and the Russell 2000. ▶️ Firms in the S&P XXX index have almost X% higher annual return than the average stock in the index ▶️But firms in the Russell 2000 index have -XXXX% annual returns Why is this? ❓ Are smaller firms taking too much profit which harms future growth? ❓Or are they making high risk bets hoping for a lottery-like payoff with the share price and their own compensation? ❓Or could this be buying low momentum stocks where compensation seems high because Enterprise Value is falling? An interesting puzzle. Has anyone looked into this before or have a relevant white paper they can point to? 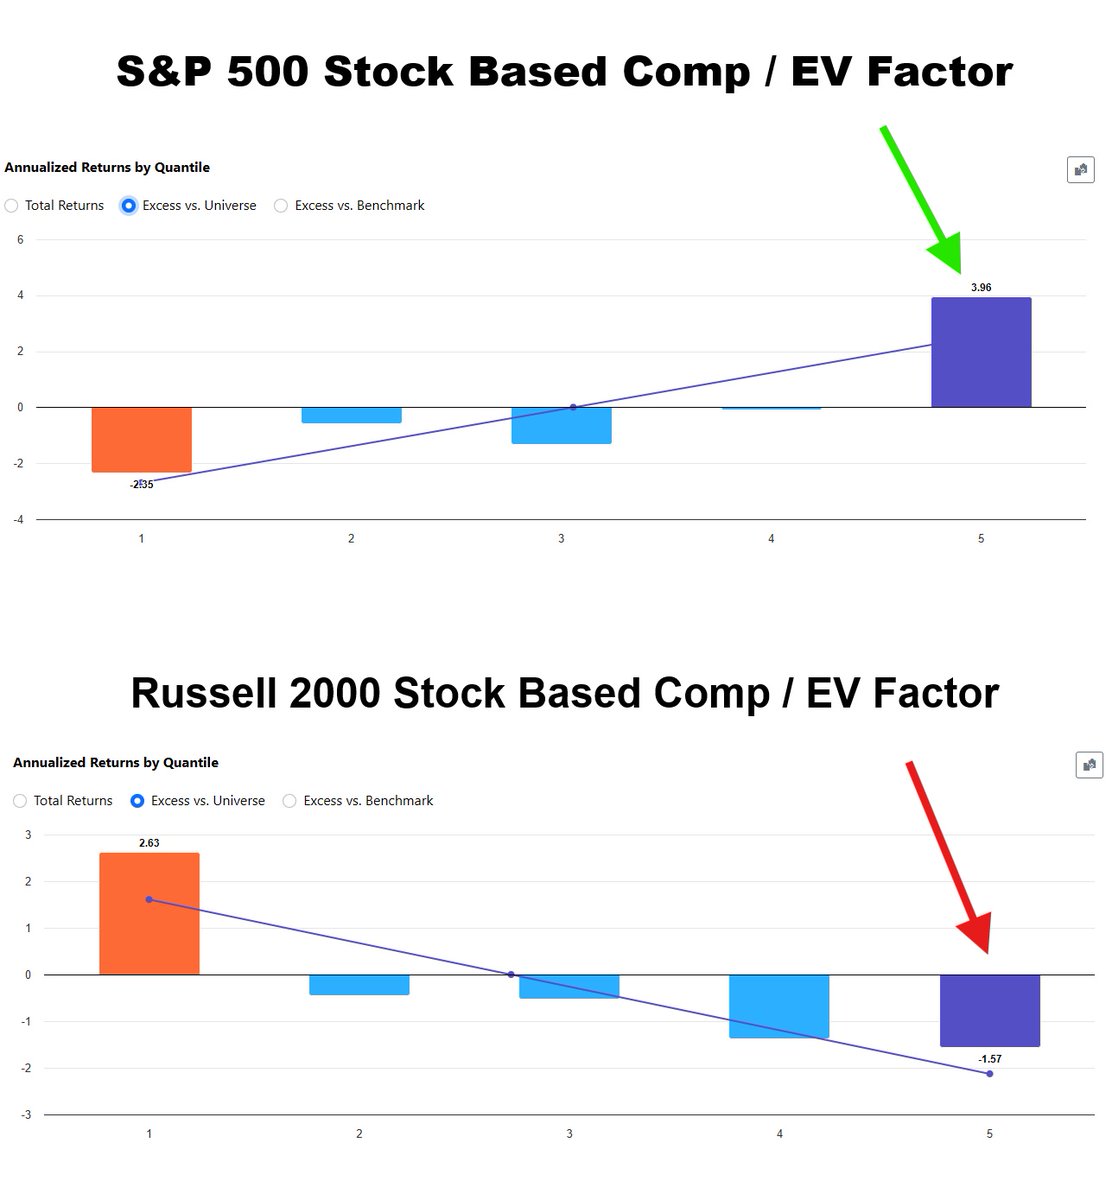 XXXXX engagements  **Related Topics** [rating agency](/topic/rating-agency) [balance sheet](/topic/balance-sheet) [$spy](/topic/$spy) [Post Link](https://x.com/Quant_Kurtis/status/1948046478414610851)
[GUEST ACCESS MODE: Data is scrambled or limited to provide examples. Make requests using your API key to unlock full data. Check https://lunarcrush.ai/auth for authentication information.]
 Kurtis The Quant @Quant_Kurtis on x 4480 followers
Created: 2025-07-23 15:44:08 UTC
Kurtis The Quant @Quant_Kurtis on x 4480 followers
Created: 2025-07-23 15:44:08 UTC
How does stock-based compensation affect share price returns? The results over the past XX years are conflicting.
The latest release of this Portfolio123 factor (based on FactSet data) is as follows:
✔️ stock-based compensation TTM (income statement) / EV
I ran a factor backtest from 2010 with this factor in the S&P XXX and the Russell 2000.
▶️ Firms in the S&P XXX index have almost X% higher annual return than the average stock in the index
▶️But firms in the Russell 2000 index have -XXXX% annual returns
Why is this?
❓ Are smaller firms taking too much profit which harms future growth?
❓Or are they making high risk bets hoping for a lottery-like payoff with the share price and their own compensation?
❓Or could this be buying low momentum stocks where compensation seems high because Enterprise Value is falling?
An interesting puzzle. Has anyone looked into this before or have a relevant white paper they can point to?

XXXXX engagements

Related Topics rating agency balance sheet $spy