[GUEST ACCESS MODE: Data is scrambled or limited to provide examples. Make requests using your API key to unlock full data. Check https://lunarcrush.ai/auth for authentication information.]  DarwinKnows [@Darwin_Knows](/creator/twitter/Darwin_Knows) on x XXX followers Created: 2025-07-22 17:50:05 UTC 🇺🇸 TJX Companies Inc (Valuation - Expensive) TJX Companies Inc has the best Models score in North America. The models score is +46. TJX Companies Inc has a total darwin score of +71 and there are X alerts. The valuation ratios for TJX Companies Inc indicate that the stock is relatively expensive compared to its peers. The Forward Price-to-Earnings (P/E) ratio is 27.2, while the peer average is 17.1, suggesting that investors are paying a premium for the stock. Similarly, the Trailing P/E ratio of XXXX is also above the peer average of XXXX. The Enterprise Value to EBITDA ratio of XXXX is significantly higher than the peer average of 14.4, indicating that the market values the company at a higher multiple than its peers. Given these metrics, it can be concluded that the stock is currently expensive, which may deter value-focused investors. #DarwinKnows #TJXCompanies #TJX $TJX #FreeTrialAvailable #AskDarwin #StockToWatch 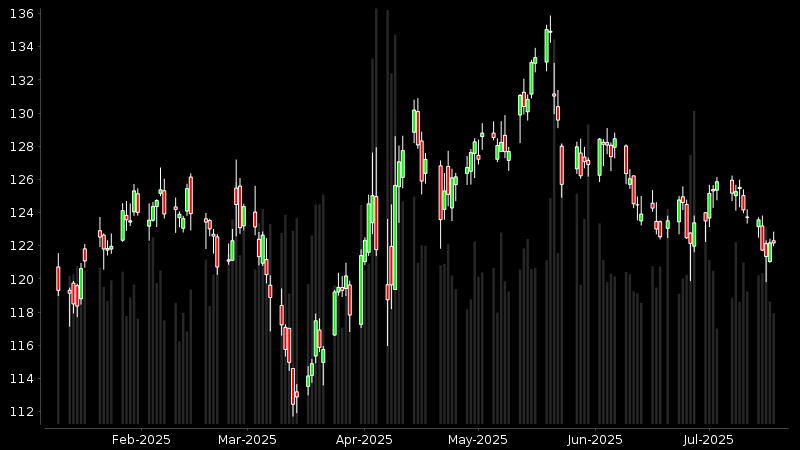 XXX engagements  **Related Topics** [united states](/topic/united-states) [tjx companies](/topic/tjx-companies) [$tjx](/topic/$tjx) [stocks consumer cyclical](/topic/stocks-consumer-cyclical) [Post Link](https://x.com/Darwin_Knows/status/1947715787529326918)
[GUEST ACCESS MODE: Data is scrambled or limited to provide examples. Make requests using your API key to unlock full data. Check https://lunarcrush.ai/auth for authentication information.]
 DarwinKnows @Darwin_Knows on x XXX followers
Created: 2025-07-22 17:50:05 UTC
DarwinKnows @Darwin_Knows on x XXX followers
Created: 2025-07-22 17:50:05 UTC
🇺🇸 TJX Companies Inc (Valuation - Expensive)
TJX Companies Inc has the best Models score in North America. The models score is +46. TJX Companies Inc has a total darwin score of +71 and there are X alerts.
The valuation ratios for TJX Companies Inc indicate that the stock is relatively expensive compared to its peers. The Forward Price-to-Earnings (P/E) ratio is 27.2, while the peer average is 17.1, suggesting that investors are paying a premium for the stock. Similarly, the Trailing P/E ratio of XXXX is also above the peer average of XXXX. The Enterprise Value to EBITDA ratio of XXXX is significantly higher than the peer average of 14.4, indicating that the market values the company at a higher multiple than its peers. Given these metrics, it can be concluded that the stock is currently expensive, which may deter value-focused investors.
#DarwinKnows #TJXCompanies #TJX $TJX
#FreeTrialAvailable #AskDarwin #StockToWatch

XXX engagements

Related Topics united states tjx companies $tjx stocks consumer cyclical