[GUEST ACCESS MODE: Data is scrambled or limited to provide examples. Make requests using your API key to unlock full data. Check https://lunarcrush.ai/auth for authentication information.]  ElonMoney [@0xelonmoney](/creator/twitter/0xelonmoney) on x 52.3K followers Created: 2025-07-22 14:58:02 UTC When the Bitcoin Heater indicator hit the red zone back in October ‘24, BTC kept rallying until January 2025. Interestingly, Heater started cooling off in December, triggering a correction, but then price surged even higher in January. On July XX this year, Heater once again entered the red zone for the first time since ‘24. Drawing parallels with last year's action, we might have about three more months of bullish momentum before a correction sets in. To get the full picture, I recommend using multiple indicators on 1D/1W charts, specifically MVRV-Z, Heater, RSI, and BBWP. I'm also a big fan of @Delphi_Digital Top Signal Dashboard, which conveniently combines several of these indicators. h/t @capriole_fund 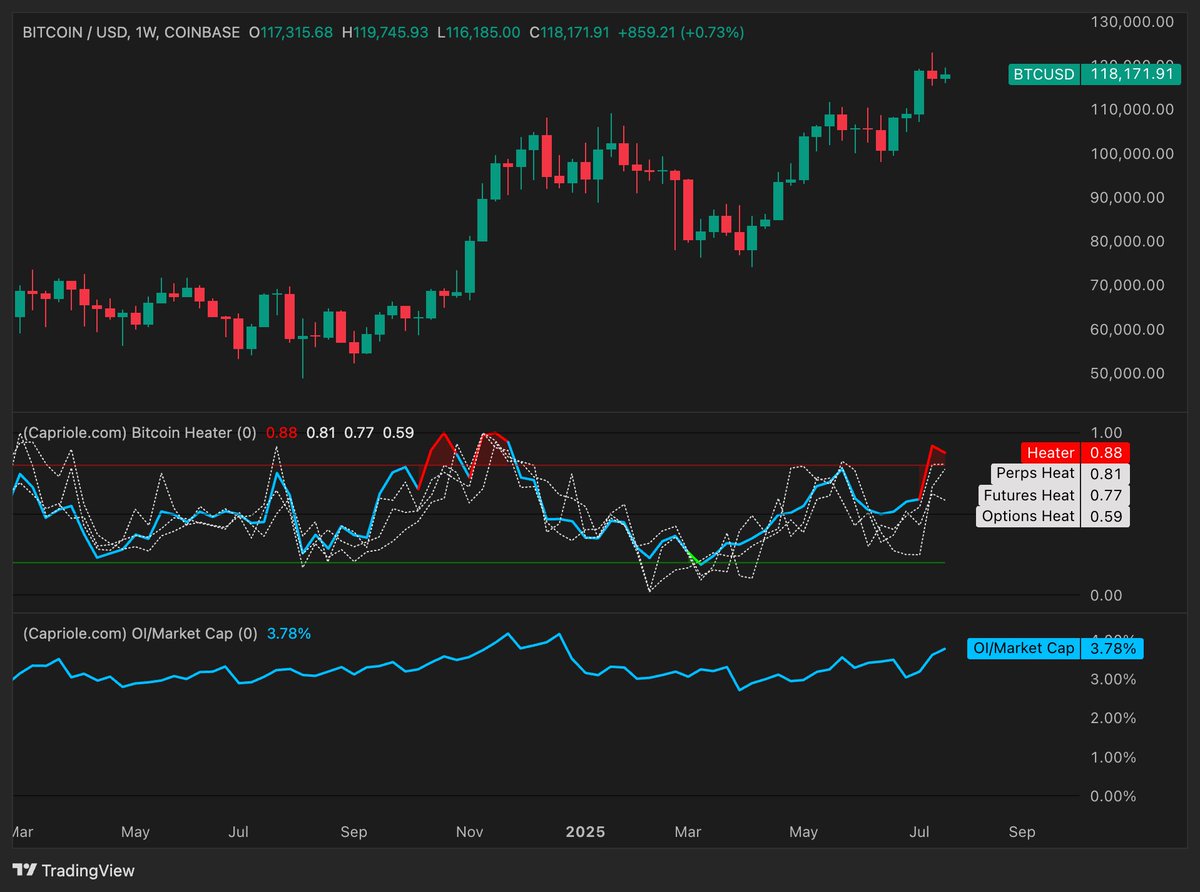 XXXXXX engagements  **Related Topics** [bitcoin](/topic/bitcoin) [coins layer 1](/topic/coins-layer-1) [coins bitcoin ecosystem](/topic/coins-bitcoin-ecosystem) [coins pow](/topic/coins-pow) [Post Link](https://x.com/0xelonmoney/status/1947672491972862090)
[GUEST ACCESS MODE: Data is scrambled or limited to provide examples. Make requests using your API key to unlock full data. Check https://lunarcrush.ai/auth for authentication information.]
 ElonMoney @0xelonmoney on x 52.3K followers
Created: 2025-07-22 14:58:02 UTC
ElonMoney @0xelonmoney on x 52.3K followers
Created: 2025-07-22 14:58:02 UTC
When the Bitcoin Heater indicator hit the red zone back in October ‘24, BTC kept rallying until January 2025. Interestingly, Heater started cooling off in December, triggering a correction, but then price surged even higher in January.
On July XX this year, Heater once again entered the red zone for the first time since ‘24. Drawing parallels with last year's action, we might have about three more months of bullish momentum before a correction sets in.
To get the full picture, I recommend using multiple indicators on 1D/1W charts, specifically MVRV-Z, Heater, RSI, and BBWP. I'm also a big fan of @Delphi_Digital Top Signal Dashboard, which conveniently combines several of these indicators.
h/t @capriole_fund

XXXXXX engagements

Related Topics bitcoin coins layer 1 coins bitcoin ecosystem coins pow