[GUEST ACCESS MODE: Data is scrambled or limited to provide examples. Make requests using your API key to unlock full data. Check https://lunarcrush.ai/auth for authentication information.]  HeidingOut [@HeidingOut](/creator/twitter/HeidingOut) on x 7162 followers Created: 2025-07-20 05:59:57 UTC I'm holding Dec XX exp calls, $XX strike position in $LMND —otherwise, I'd advise everyone to move on. These aren't high-confidence setups. The market is clearly signaling that it's time to step back and preserve your gains. But since I'm already committed, here we are. In hindsight, I should have trimmed more of $LMND options on Fri when it hit that double top at $XXXXX. Life got busy, fam! That said, the 4W chart still looks bullish to me. Take a look at the shorter-term 1D and 1W charts for $LMND. It broke below the April trendline —check the yellow arrow. This might just be a squat (a liquidity sweep), and the double top could be a fakeout. We're seeing $LMND with higher recent highs and higher lows on the daily timeframe. There's also a three-drives pattern in play, with a measured move targeting $XXXXX before any potential pullback. Of course, the fifth Elliott Wave could wrap up right here without pushing to new highs — that's a real possibility. Also, $LMND completing this three-drives pattern turns extremely bearish once price hits $XXXXX. Alternatively, we'd flip bearish on a break of the double top's neckline or the lower trendline. Either way, I've set $LMND alerts for the double top neckline break, the trendline breach, and several for RSI and price surpassing the recent wave all-time high. My $LMND calls are performing well (they were purchased a few wks ago), and I've given my stop loss some extra cushion since they don't expire for another six months — saved me last week. Potential downside targets for $LMND include $35.03, followed by $32.23, and then $XXXXX. On the RSI, there's hidden bullish divergence showing up on the 1D and 2D charts. I do favor the bullish signals from Sto and RSI patterns. Still, I'm not recommending anyone enter $LMND at this juncture, I'm staying cautiously optimistic and wouldn't suggest jumping in if you're not already positioned. This is a mature market—time to lock in some profits and hold onto capital for the inevitable dip ahead. Let's just say $LMND isn't really "lemon squeezy, easy peasy" atm. 🤣 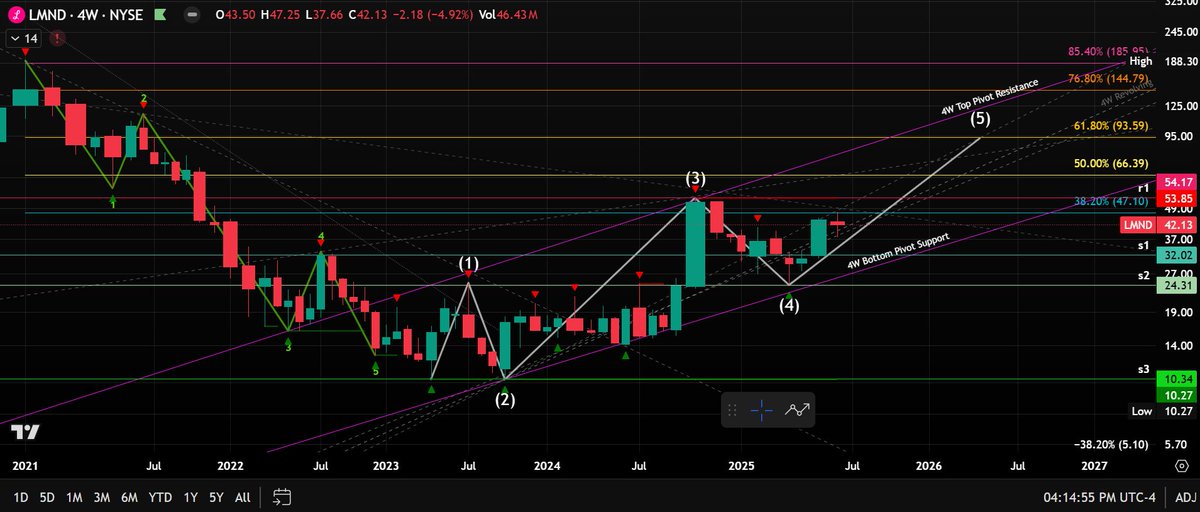 XXXXX engagements  **Related Topics** [dec](/topic/dec) [$lmnd](/topic/$lmnd) [Post Link](https://x.com/HeidingOut/status/1946812300653957302)
[GUEST ACCESS MODE: Data is scrambled or limited to provide examples. Make requests using your API key to unlock full data. Check https://lunarcrush.ai/auth for authentication information.]
 HeidingOut @HeidingOut on x 7162 followers
Created: 2025-07-20 05:59:57 UTC
HeidingOut @HeidingOut on x 7162 followers
Created: 2025-07-20 05:59:57 UTC
I'm holding Dec XX exp calls, $XX strike position in $LMND —otherwise, I'd advise everyone to move on. These aren't high-confidence setups. The market is clearly signaling that it's time to step back and preserve your gains. But since I'm already committed, here we are. In hindsight, I should have trimmed more of $LMND options on Fri when it hit that double top at $XXXXX. Life got busy, fam! That said, the 4W chart still looks bullish to me.
Take a look at the shorter-term 1D and 1W charts for $LMND. It broke below the April trendline —check the yellow arrow. This might just be a squat (a liquidity sweep), and the double top could be a fakeout.
We're seeing $LMND with higher recent highs and higher lows on the daily timeframe. There's also a three-drives pattern in play, with a measured move targeting $XXXXX before any potential pullback. Of course, the fifth Elliott Wave could wrap up right here without pushing to new highs — that's a real possibility.
Also, $LMND completing this three-drives pattern turns extremely bearish once price hits $XXXXX. Alternatively, we'd flip bearish on a break of the double top's neckline or the lower trendline.
Either way, I've set $LMND alerts for the double top neckline break, the trendline breach, and several for RSI and price surpassing the recent wave all-time high.
My $LMND calls are performing well (they were purchased a few wks ago), and I've given my stop loss some extra cushion since they don't expire for another six months — saved me last week.
Potential downside targets for $LMND include $35.03, followed by $32.23, and then $XXXXX.
On the RSI, there's hidden bullish divergence showing up on the 1D and 2D charts. I do favor the bullish signals from Sto and RSI patterns.
Still, I'm not recommending anyone enter $LMND at this juncture, I'm staying cautiously optimistic and wouldn't suggest jumping in if you're not already positioned. This is a mature market—time to lock in some profits and hold onto capital for the inevitable dip ahead.
Let's just say $LMND isn't really "lemon squeezy, easy peasy" atm. 🤣

XXXXX engagements
