[GUEST ACCESS MODE: Data is scrambled or limited to provide examples. Make requests using your API key to unlock full data. Check https://lunarcrush.ai/auth for authentication information.]  @ImmaculateTony.Eth 🦉 [@ImmaculateTony](/creator/twitter/ImmaculateTony) on x XXX followers Created: 2025-07-19 23:48:50 UTC $QCOM is displaying a compelling technical structure on the weekly timeframe, suggesting significant upside potential. The stock has been trading within a clear ascending channel since 2019, establishing a strong, multi-year uptrend. In April 2025, the price successfully tested a critical demand zone around $125-$130, a powerful confluence of the channel's lower trendline and the pivotal 200-week EMA. A decisive bounce from such a robust support level is a strong technical confirmation of the underlying bullish trend. Following this bounce, $QCOM has now broken out from a descending trendline that capped gains for the past year, signaling a potential resumption of the primary uptrend and a new leg higher. Key Levels to Watch: Demand (Support): $125-$130 (major), ~$150 (immediate). Supply (Resistance): $175-$185 (next target), then all-time highs near $XXX. Indicators like the Weinstein Stage Analysis (confirming a "Stage 2" uptrend) and the Parabolic SAR on shorter timeframes align with this bullish outlook. The combination of a long-term uptrend, a successful test of major support, and a recent breakout presents a strong case for bulls. #QCOM #TechnicalAnalysis #StockMarket #Trading #Bullish #Investing #ChartPattern 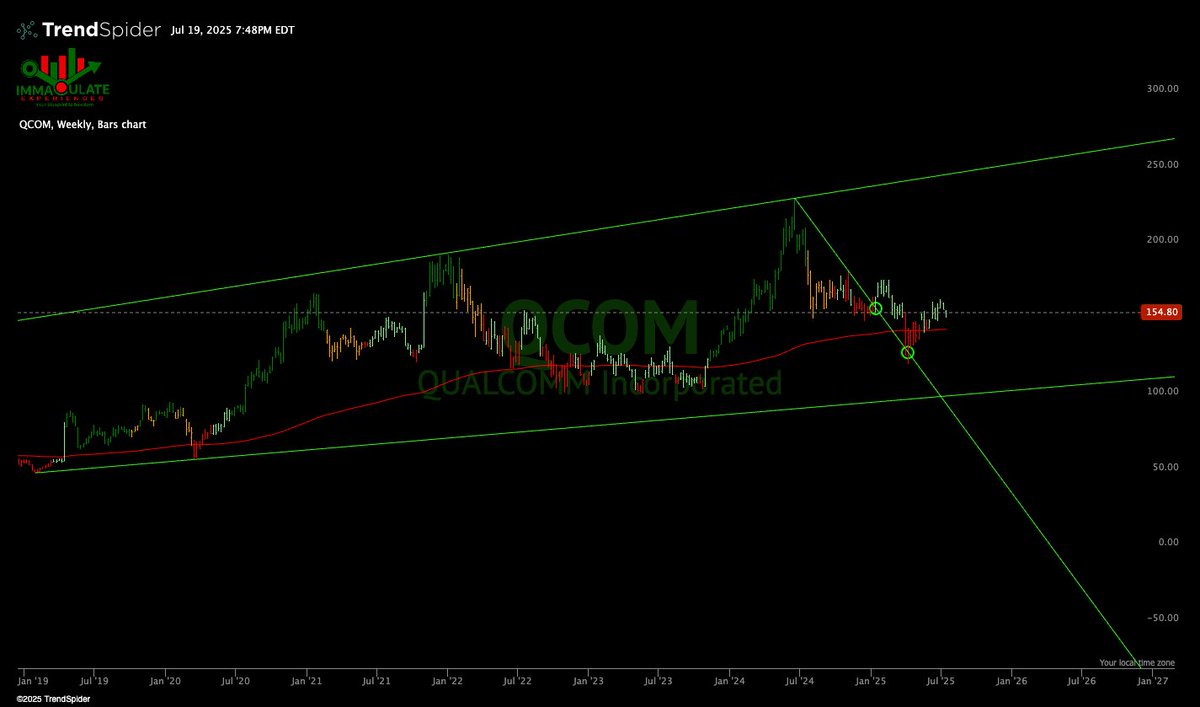 XX engagements  **Related Topics** [$qcom](/topic/$qcom) [stocks technology](/topic/stocks-technology) [Post Link](https://x.com/ImmaculateTony/status/1946718905910935649)
[GUEST ACCESS MODE: Data is scrambled or limited to provide examples. Make requests using your API key to unlock full data. Check https://lunarcrush.ai/auth for authentication information.]
 @ImmaculateTony.Eth 🦉 @ImmaculateTony on x XXX followers
Created: 2025-07-19 23:48:50 UTC
@ImmaculateTony.Eth 🦉 @ImmaculateTony on x XXX followers
Created: 2025-07-19 23:48:50 UTC
$QCOM is displaying a compelling technical structure on the weekly timeframe, suggesting significant upside potential. The stock has been trading within a clear ascending channel since 2019, establishing a strong, multi-year uptrend.
In April 2025, the price successfully tested a critical demand zone around $125-$130, a powerful confluence of the channel's lower trendline and the pivotal 200-week EMA. A decisive bounce from such a robust support level is a strong technical confirmation of the underlying bullish trend.
Following this bounce, $QCOM has now broken out from a descending trendline that capped gains for the past year, signaling a potential resumption of the primary uptrend and a new leg higher.
Key Levels to Watch:
Demand (Support): $125-$130 (major), ~$150 (immediate).
Supply (Resistance): $175-$185 (next target), then all-time highs near $XXX.
Indicators like the Weinstein Stage Analysis (confirming a "Stage 2" uptrend) and the Parabolic SAR on shorter timeframes align with this bullish outlook. The combination of a long-term uptrend, a successful test of major support, and a recent breakout presents a strong case for bulls.
#QCOM #TechnicalAnalysis #StockMarket #Trading #Bullish #Investing #ChartPattern

XX engagements

Related Topics $qcom stocks technology