[GUEST ACCESS MODE: Data is scrambled or limited to provide examples. Make requests using your API key to unlock full data. Check https://lunarcrush.ai/auth for authentication information.]  Pavlos D ✈️ [@d_pavlos](/creator/twitter/d_pavlos) on x 17K followers Created: 2025-07-19 12:56:35 UTC $CEG – Weekly Chart Open: XXXXXX | High: XXXXXX | Low: XXXXXX | Close: XXXXXX | Change: +4.33% 💥 Looks like a solid continuation buy point — $CEG is coiling inside a bullish triangle consolidation, forming after a strong 5-wave impulse. The breakout is developing just above the XXXXX Fib (307.01), suggesting a wave X triangle setup with a potential wave X breakout ahead. Volume remains supportive, and the MACD (20.02) is rising with bullish histogram action. RSI at XXXXX gives plenty of room for continuation. A weekly close above $XXX would likely trigger a measured move toward $352, with extended targets at $424–$447. 📌 Buy Trigger: Triangle breakout > $XXX 📉 Key Support to Hold: $307, $XXXXXX Stop chasing lottery tickets. Start trading with a plan. 🔗 #SPY #SPX #Trading #Stocks #ElliottWave #Options #Invest 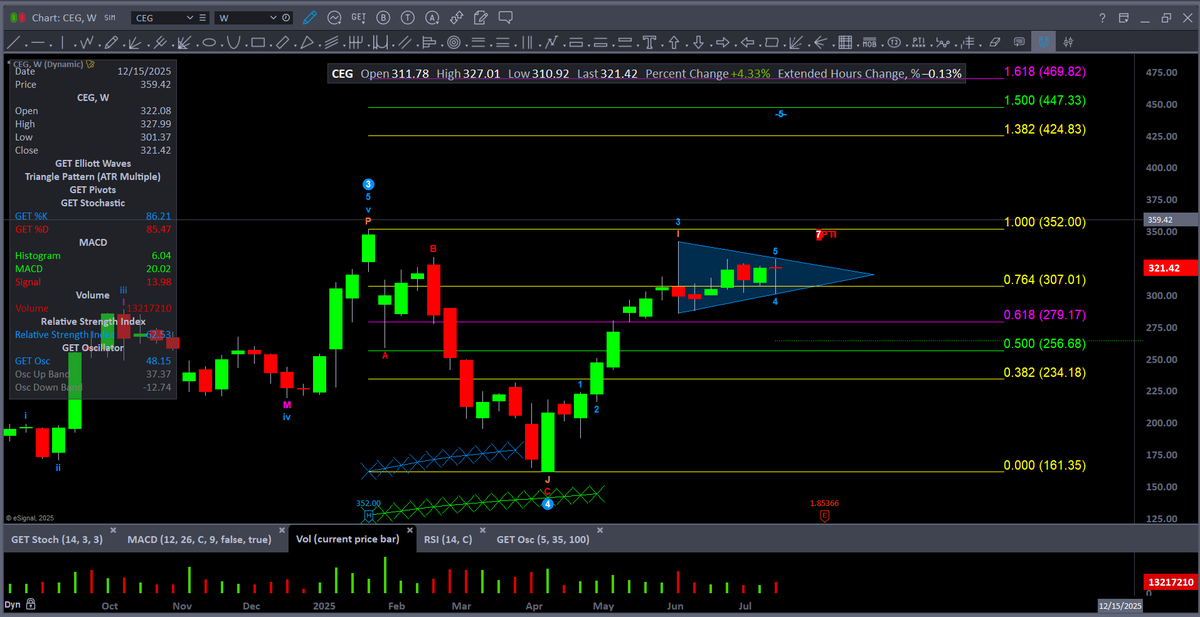 XXX engagements  **Related Topics** [$ceg](/topic/$ceg) [constellation energy corp](/topic/constellation-energy-corp) [stocks utilities](/topic/stocks-utilities) [Post Link](https://x.com/d_pavlos/status/1946554761764852202)
[GUEST ACCESS MODE: Data is scrambled or limited to provide examples. Make requests using your API key to unlock full data. Check https://lunarcrush.ai/auth for authentication information.]
 Pavlos D ✈️ @d_pavlos on x 17K followers
Created: 2025-07-19 12:56:35 UTC
Pavlos D ✈️ @d_pavlos on x 17K followers
Created: 2025-07-19 12:56:35 UTC
$CEG – Weekly Chart Open: XXXXXX | High: XXXXXX | Low: XXXXXX | Close: XXXXXX | Change: +4.33%
💥 Looks like a solid continuation buy point — $CEG is coiling inside a bullish triangle consolidation, forming after a strong 5-wave impulse. The breakout is developing just above the XXXXX Fib (307.01), suggesting a wave X triangle setup with a potential wave X breakout ahead. Volume remains supportive, and the MACD (20.02) is rising with bullish histogram action. RSI at XXXXX gives plenty of room for continuation. A weekly close above $XXX would likely trigger a measured move toward $352, with extended targets at $424–$447.
📌 Buy Trigger: Triangle breakout > $XXX 📉 Key Support to Hold: $307, $XXXXXX
Stop chasing lottery tickets. Start trading with a plan. 🔗
#SPY #SPX #Trading #Stocks #ElliottWave #Options #Invest

XXX engagements

Related Topics $ceg constellation energy corp stocks utilities