[GUEST ACCESS MODE: Data is scrambled or limited to provide examples. Make requests using your API key to unlock full data. Check https://lunarcrush.ai/auth for authentication information.]  Sergey [@SergeyCYW](/creator/twitter/SergeyCYW) on x 6355 followers Created: 2025-07-19 12:31:04 UTC SaaS companies* are typically evaluated based on the EV/Sales multiple relative to their projected revenue growth for the next year. Evaluating growth stocks using forward projected revenue growth is crucial for investors because it provides insight into the company's future potential rather than just its current performance. Additionally, understanding forward growth helps investors make informed decisions by comparing a company’s projections with its industry peers and market expectations, providing a clearer view of its growth trajectory. I also include data on Operating Margin in the chart, as it impacts company valuation. Companies with a high positive operating margin should be valued higher than those with a negative operating margin. On the chart, companies with a negative operating margin are marked in red, those with an operating margin below X% in yellow, and those with an operating margin above X% in green. In this case, I used the GAAP Operating Margin from the most recent quarter. It helps identify the latest trends and highlights companies that have recently achieved operating profitability. However, for companies affected by seasonality, the data may be distorted. *-Selection criteria: software companies with the majority of their revenue subscription-based, EV over $X billion, and a gross margin above 70%. The chart includes the most popular stocks: $CRWD $PLTR $NET $DDOG $ZS $SNOW $MDB $NOW $AXON $PANW $HUBS $AI $MSFT $AMZN $GOOG $ADBE $CRM. P.S. To make the data on the chart easier to read, I removed $PLTR, which is trading at XXXX EV/Sales. 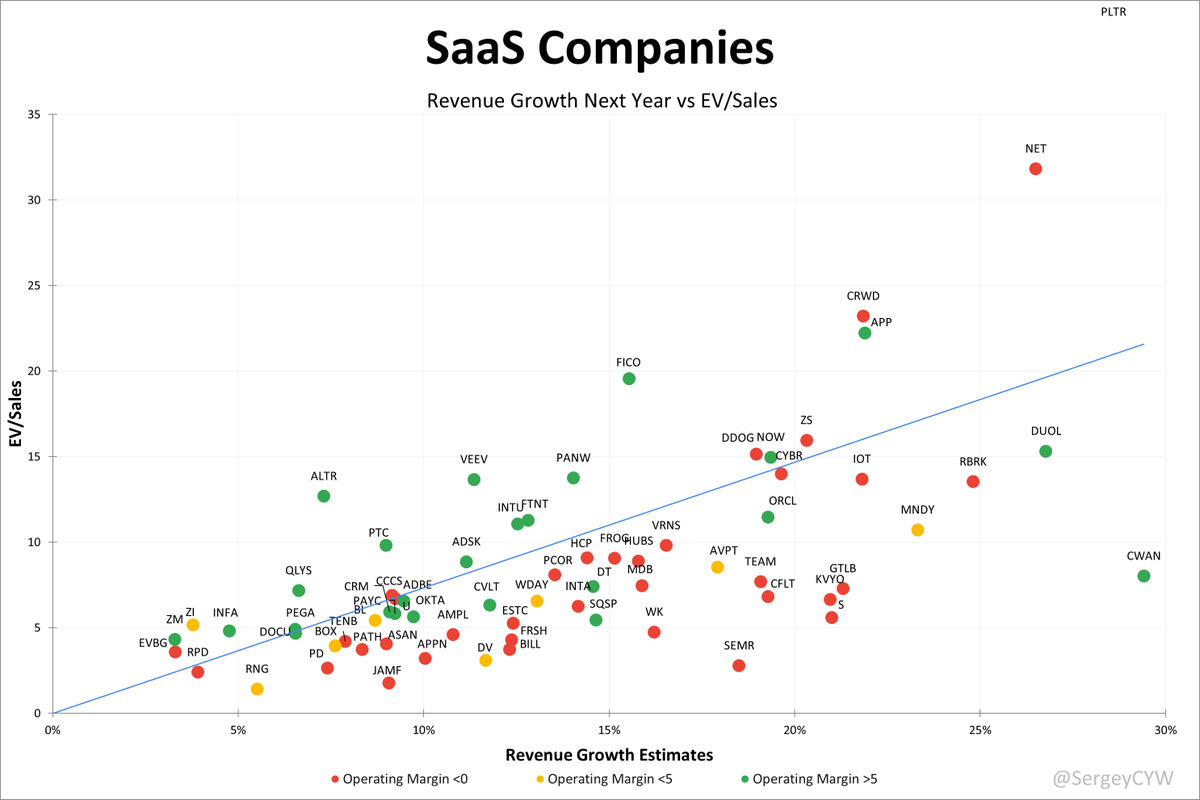 XXXXX engagements  **Related Topics** [stocks](/topic/stocks) [quarterly earnings](/topic/quarterly-earnings) [Post Link](https://x.com/SergeyCYW/status/1946548342655451201)
[GUEST ACCESS MODE: Data is scrambled or limited to provide examples. Make requests using your API key to unlock full data. Check https://lunarcrush.ai/auth for authentication information.]
 Sergey @SergeyCYW on x 6355 followers
Created: 2025-07-19 12:31:04 UTC
Sergey @SergeyCYW on x 6355 followers
Created: 2025-07-19 12:31:04 UTC
SaaS companies* are typically evaluated based on the EV/Sales multiple relative to their projected revenue growth for the next year.
Evaluating growth stocks using forward projected revenue growth is crucial for investors because it provides insight into the company's future potential rather than just its current performance.
Additionally, understanding forward growth helps investors make informed decisions by comparing a company’s projections with its industry peers and market expectations, providing a clearer view of its growth trajectory.
I also include data on Operating Margin in the chart, as it impacts company valuation. Companies with a high positive operating margin should be valued higher than those with a negative operating margin.
On the chart, companies with a negative operating margin are marked in red, those with an operating margin below X% in yellow, and those with an operating margin above X% in green.
In this case, I used the GAAP Operating Margin from the most recent quarter. It helps identify the latest trends and highlights companies that have recently achieved operating profitability. However, for companies affected by seasonality, the data may be distorted.
*-Selection criteria: software companies with the majority of their revenue subscription-based, EV over $X billion, and a gross margin above 70%.
The chart includes the most popular stocks: $CRWD $PLTR $NET $DDOG $ZS $SNOW $MDB $NOW $AXON $PANW $HUBS $AI $MSFT $AMZN $GOOG $ADBE $CRM.
P.S. To make the data on the chart easier to read, I removed $PLTR, which is trading at XXXX EV/Sales.

XXXXX engagements

Related Topics stocks quarterly earnings