[GUEST ACCESS MODE: Data is scrambled or limited to provide examples. Make requests using your API key to unlock full data. Check https://lunarcrush.ai/auth for authentication information.]  Staudinger [@Staudinger333](/creator/twitter/Staudinger333) on x XXX followers Created: 2025-07-19 01:01:29 UTC $RKLB: A look at the weekly chart (shown below) has MFI starting to get into extreme overbought territory (MFI > 80). Note this is the weekly chart, not the daily which is less reliable, IMO. I do think there is still some more room to run up here next week (as was the case last year after MFI crossed 80), but for those thinking that stonks only go up and we'll hit $XX before any meaningful pullbacks, remember, the 200d simple moving average is at about $XX currently and it acts like a magnet when stock prices get two or more standard deviations away. Based on this analysis, I trimmed another XX% of my $XX Aug X calls today to lock in additional profits after seeing them 5x and taking profits yesterday. I will also start selling OTM CCs on any big move up next week as I think we're likely to see a pullback to $39-42 range soon based on simple Fib retracement analysis (similar to ASTS' recent move). Obviously, not financial advice. Just how I see it and how I've been playing this one since the early SPAC days. Best of luck... 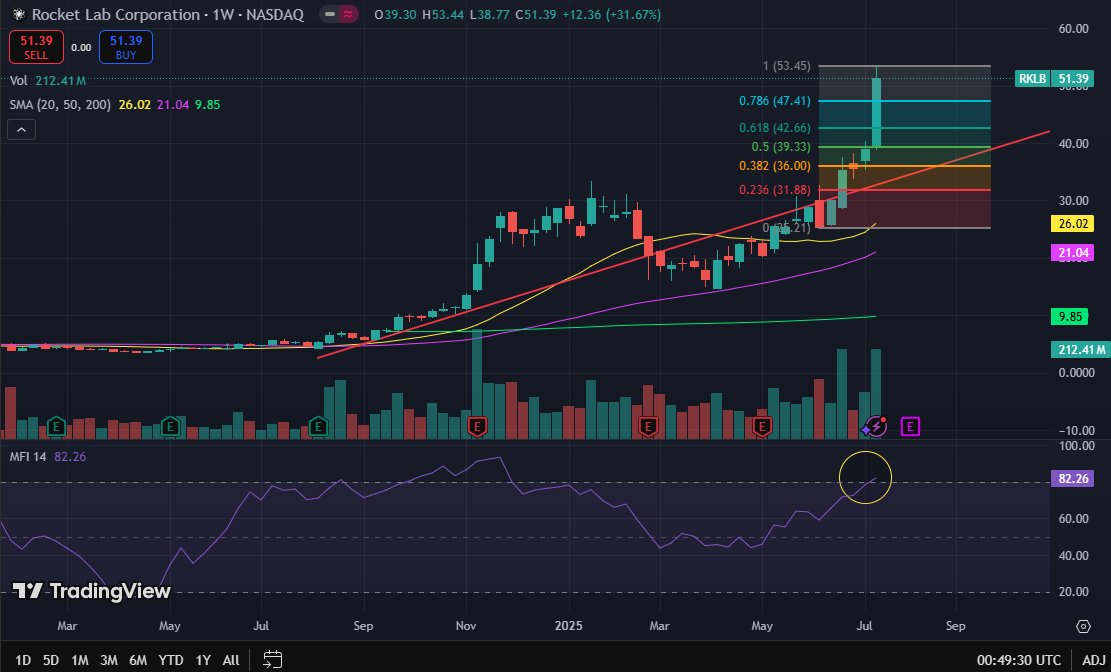 XXXXX engagements  **Related Topics** [$rklb](/topic/$rklb) [$4547](/topic/$4547) [coins solana ecosystem](/topic/coins-solana-ecosystem) [coins meme](/topic/coins-meme) [Post Link](https://x.com/Staudinger333/status/1946374801544634408)
[GUEST ACCESS MODE: Data is scrambled or limited to provide examples. Make requests using your API key to unlock full data. Check https://lunarcrush.ai/auth for authentication information.]
 Staudinger @Staudinger333 on x XXX followers
Created: 2025-07-19 01:01:29 UTC
Staudinger @Staudinger333 on x XXX followers
Created: 2025-07-19 01:01:29 UTC
$RKLB: A look at the weekly chart (shown below) has MFI starting to get into extreme overbought territory (MFI > 80). Note this is the weekly chart, not the daily which is less reliable, IMO. I do think there is still some more room to run up here next week (as was the case last year after MFI crossed 80), but for those thinking that stonks only go up and we'll hit $XX before any meaningful pullbacks, remember, the 200d simple moving average is at about $XX currently and it acts like a magnet when stock prices get two or more standard deviations away.
Based on this analysis, I trimmed another XX% of my $XX Aug X calls today to lock in additional profits after seeing them 5x and taking profits yesterday. I will also start selling OTM CCs on any big move up next week as I think we're likely to see a pullback to $39-42 range soon based on simple Fib retracement analysis (similar to ASTS' recent move).
Obviously, not financial advice. Just how I see it and how I've been playing this one since the early SPAC days. Best of luck...

XXXXX engagements

Related Topics $rklb $4547 coins solana ecosystem coins meme