[GUEST ACCESS MODE: Data is scrambled or limited to provide examples. Make requests using your API key to unlock full data. Check https://lunarcrush.ai/auth for authentication information.]  Ser Golu [@CryptoGayani72](/creator/twitter/CryptoGayani72) on x XXX followers Created: 2025-07-18 16:54:47 UTC $726.6M in $ETH inflows is equivalent to $4.25B of inflows into BTC when adjusted for market cap. BTC market cap: $XXXX trillion ETH market cap: $XXX billion Ratio = 2.37T / 405B ≈ XXXX This is insane 🤯#Eth challenging the dominance. 1SS> The Bull Market Support Band Last year (red arrow), when rate cuts did not happen, Uemployment rate was at 4.1, So Quantitative tightning thus $ETH needed to go home and it did. This year(green arrow) rate cuts have happened, Unemployment rate at XXX and this kind of Institutional backing so I'm not as closed off to the idea, that there's a chance that it holds bull market support band. 2SS> The X Quarter pull Backs. Historically If we compare to 2017 , 2023, 2024 we have seen a pull back in $ETH, possibly followed by a rally towards the end of the year, similar to patterns observed in previous years. But there is also a strong possibility of $ETH going to ATH now and then have a pull back. 3SS> Everything makes sense for $ETH now During this period (2023 to june 2025) ETH/BTC went Home and kept making lower lows, but it all makes sense ,with earlier cycle(2017,2019, 2020) considerations (yellow arrows). although we are at higher low that makes me unsure of the path whether there is going to be ATH or a pull back. 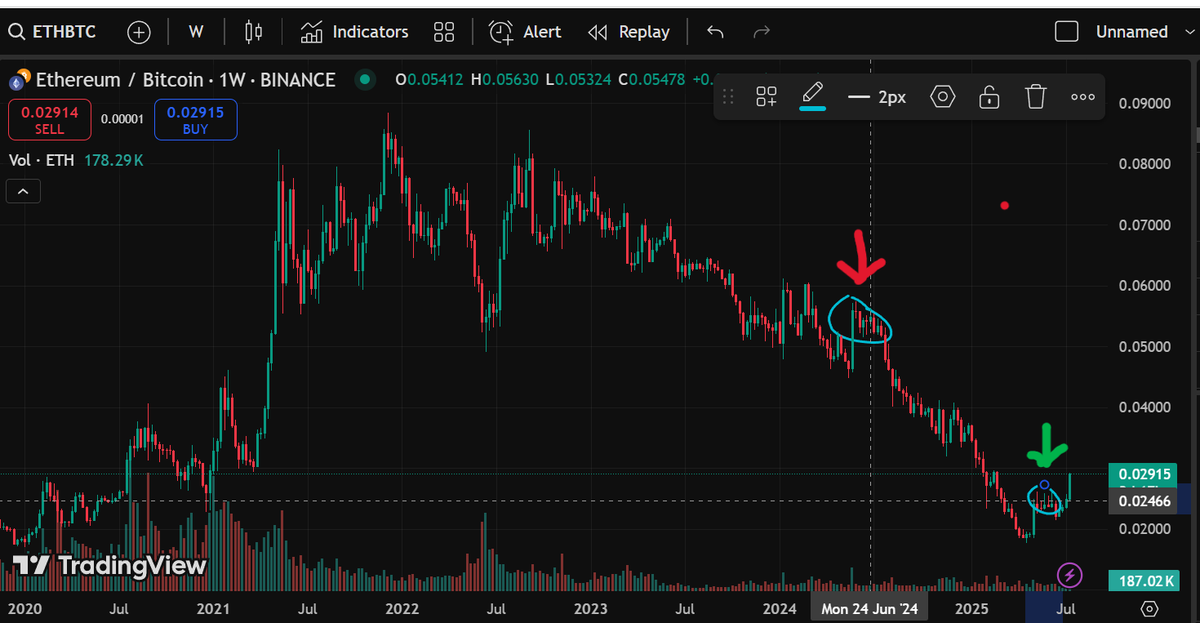 XX engagements  **Related Topics** [market cap](/topic/market-cap) [dominance](/topic/dominance) [#eth](/topic/#eth) [$425b](/topic/$425b) [$eth](/topic/$eth) [$7266m](/topic/$7266m) [ethereum](/topic/ethereum) [coins layer 1](/topic/coins-layer-1) [Post Link](https://x.com/CryptoGayani72/status/1946252321807057371)
[GUEST ACCESS MODE: Data is scrambled or limited to provide examples. Make requests using your API key to unlock full data. Check https://lunarcrush.ai/auth for authentication information.]
 Ser Golu @CryptoGayani72 on x XXX followers
Created: 2025-07-18 16:54:47 UTC
Ser Golu @CryptoGayani72 on x XXX followers
Created: 2025-07-18 16:54:47 UTC
$726.6M in $ETH inflows is equivalent to $4.25B of inflows into BTC when adjusted for market cap.
BTC market cap: $XXXX trillion ETH market cap: $XXX billion Ratio = 2.37T / 405B ≈ XXXX This is insane 🤯#Eth challenging the dominance. 1SS> The Bull Market Support Band Last year (red arrow), when rate cuts did not happen, Uemployment rate was at 4.1, So Quantitative tightning thus $ETH needed to go home and it did. This year(green arrow) rate cuts have happened, Unemployment rate at XXX and this kind of Institutional backing so I'm not as closed off to the idea, that there's a chance that it holds bull market support band. 2SS> The X Quarter pull Backs. Historically If we compare to 2017 , 2023, 2024 we have seen a pull back in $ETH, possibly followed by a rally towards the end of the year, similar to patterns observed in previous years. But there is also a strong possibility of $ETH going to ATH now and then have a pull back. 3SS> Everything makes sense for $ETH now During this period (2023 to june 2025) ETH/BTC went Home and kept making lower lows, but it all makes sense ,with earlier cycle(2017,2019, 2020) considerations (yellow arrows). although we are at higher low that makes me unsure of the path whether there is going to be ATH or a pull back.

XX engagements

Related Topics market cap dominance #eth $425b $eth $7266m ethereum coins layer 1