[GUEST ACCESS MODE: Data is scrambled or limited to provide examples. Make requests using your API key to unlock full data. Check https://lunarcrush.ai/auth for authentication information.]  $Trader [@GDXTrader](/creator/twitter/GDXTrader) on x 11.5K followers Created: 2025-07-18 14:51:33 UTC 𝐆𝐨𝐥𝐝𝐞𝐧👁️ - 𝐃𝐫𝐚𝐧𝐠𝐨𝐧𝐟𝐥𝐲 𝐃𝐨𝐣𝐢 𝐄𝐱𝐩𝐥𝐚𝐢𝐧𝐞𝐝 A Dragonfly Doji is a candlestick pattern characterized by a long lower wick, little to no upper wick, and a close near the open, forming a “T” shape. It typically appears after a downtrend and signals potential reversal, as it indicates that, although sellers initially pushed the price down, buyers stepped in to bring it back near the opening level by the close. The implications of a Dragonfly Doji differ from a bullish hammer because, with a Doji, the open and close prices are nearly identical, indicating more indecision. In contrast, a bullish hammer closes higher than it opens, showing clearer buying strength by the close. The Doji’s indecision suggests the battle between buyers and sellers was intense, while a hammer implies buyers had stronger control by the end of the session. - To trade a Dragonfly Doji, wait for confirmation from the next candle. - A bullish follow-up candle that closes above the Doji’s high confirms the reversal. - Enter above this level, with a stop-loss below the Doji’s low to manage risk. The psychology behind the Dragonfly Doji reflects a shift in market sentiment. Initially, sellers dominate, driving prices lower. However, the return to the open level suggests buyers are entering the market, challenging sellers and signaling a potential bottom. This tug-of-war creates a key moment of indecision, and confirmation from the next candle shows whether bulls are truly in control. To learn more about Japanese candlesticks, explore our centralized database of top candle reversal setups, or join our coaching sessions focused on trading commodities exclusively with Japanese candlestick analysis, visit us at #DragonflyDoji #CandlestickPatterns #TechnicalAnalysis #ReversalSignal #TradingPsychology $NVDA $TSLA $AAPL $MSFT $AMZN $GOOGL $FB $JPM $GOOG $BRK.B $JNJ $V $MA $WMT $PG $BABA $DIS $VZ $CRM $UNH $PYPL $NFLX $HD $KO $INTC  XXXXX engagements  **Related Topics** [trader](/topic/trader) [reversal](/topic/reversal) [signals](/topic/signals) [$trader](/topic/$trader) [Post Link](https://x.com/GDXTrader/status/1946221306510291398)
[GUEST ACCESS MODE: Data is scrambled or limited to provide examples. Make requests using your API key to unlock full data. Check https://lunarcrush.ai/auth for authentication information.]
 $Trader @GDXTrader on x 11.5K followers
Created: 2025-07-18 14:51:33 UTC
𝐆𝐨𝐥𝐝𝐞𝐧👁️ - 𝐃𝐫𝐚𝐧𝐠𝐨𝐧𝐟𝐥𝐲 𝐃𝐨𝐣𝐢 𝐄𝐱𝐩𝐥𝐚𝐢𝐧𝐞𝐝
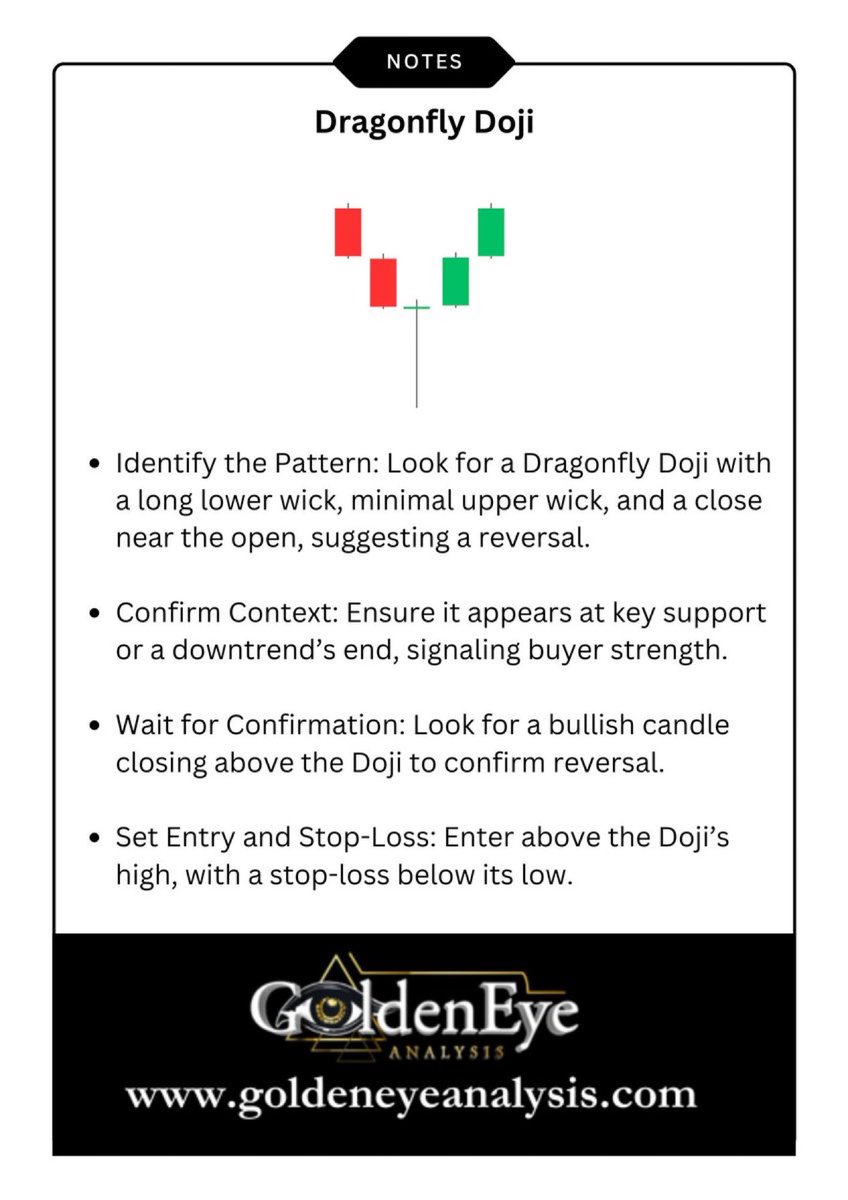
A Dragonfly Doji is a candlestick pattern characterized by a long lower wick, little to no upper wick, and a close near the open, forming a “T” shape.
It typically appears after a downtrend and signals potential reversal, as it indicates that, although sellers initially pushed the price down, buyers stepped in to bring it back near the opening level by the close.
The implications of a Dragonfly Doji differ from a bullish hammer because, with a Doji, the open and close prices are nearly identical, indicating more indecision. In contrast, a bullish hammer closes higher than it opens, showing clearer buying strength by the close. The Doji’s indecision suggests the battle between buyers and sellers was intense, while a hammer implies buyers had stronger control by the end of the session.
To trade a Dragonfly Doji, wait for confirmation from the next candle.
A bullish follow-up candle that closes above the Doji’s high confirms the reversal.
Enter above this level, with a stop-loss below the Doji’s low to manage risk.
The psychology behind the Dragonfly Doji reflects a shift in market sentiment.
Initially, sellers dominate, driving prices lower. However, the return to the open level suggests buyers are entering the market, challenging sellers and signaling a potential bottom.
This tug-of-war creates a key moment of indecision, and confirmation from the next candle shows whether bulls are truly in control.
To learn more about Japanese candlesticks, explore our centralized database of top candle reversal setups, or join our coaching sessions focused on trading commodities exclusively with Japanese candlestick analysis, visit us at
#DragonflyDoji #CandlestickPatterns #TechnicalAnalysis #ReversalSignal #TradingPsychology
$NVDA $TSLA $AAPL $MSFT $AMZN $GOOGL $FB $JPM $GOOG $BRK.B $JNJ $V $MA $WMT $PG $BABA $DIS $VZ $CRM $UNH $PYPL $NFLX $HD $KO $INTC

XXXXX engagements