[GUEST ACCESS MODE: Data is scrambled or limited to provide examples. Make requests using your API key to unlock full data. Check https://lunarcrush.ai/auth for authentication information.]  Cryptoguy49 [@Cryptoguy49](/creator/twitter/Cryptoguy49) on x XXX followers Created: 2025-07-18 10:19:16 UTC Ethereum touched $XXXXX. A solid bounce. Enough to wake the timeline up again.🧵⬇️ A few months ago, people were memeing its funeral. It was called “dead tech.” L2 wars, regulatory heat, slow dev cycles the narrative was fading. So I stepped back and asked what does the data really say? But then I looked at the data. Turns out, Ethereum’s economy is doing the exact opposite of dying. As of early July, Token Terminal reported that the GDP of Ethereum measured in user-paid fees had crossed $XX billion. And here’s the wild part: 2025 was already shaping up to be its most productive year ever. What does “Ethereum GDP” even mean? Token Terminal tracks GDP as the total value of fees paid by users to interact with applications on Ethereum. Not gas fees. Not protocol revenue. Just raw demand how much end users are actually willing to pay to use things. Why use fees instead of revenue? Because some of Ethereum’s most used apps like Uniswap or Morpho have a X% take rate. They don’t generate traditional revenue, but they clearly create massive value and attract real usage. So fees become a clean signal of where demand flows on-chain. Stablecoins have taken over Ethereum’s economy Here’s where it gets interesting. Back in the 2021–2022 cycle, Ethereum’s top GDP contributors were NFT marketplaces like OpenSea and LooksRare. But in 2025, there’s been a structural shift. The top GDP driver now? Stablecoins. Stablecoin issuers led by Tether (USDT) and Circle (USDC) accounted for: XX% of Ethereum’s all time GDP XXXX% of Ethereum’s GDP in 2025 alone (as of July) That’s an insane concentration of activity. And in the XX days leading up to that report, Tether and Circle had driven more economic activity than the rest of the top XX Ethereum dApps combined. From JPEGs to real dollars This shift is more than just numbers it’s a signal. Ethereum’s economic engine is moving from speculative JPEG trading to dollar based, real-world utility. Stablecoins = payment rails On-chain FX Institutional adoption Cross border remittance On-chain treasuries And this is just the start. In an L2 dominated world, with better UX and lower fees, Ethereum’s GDP might not just grow it might go vertical. Final thought: The next time someone says Ethereum is dead show them the receipts. Because this isn’t hopium. It’s on-chain data. @tokenterminal @BitImmortal @simplykashif 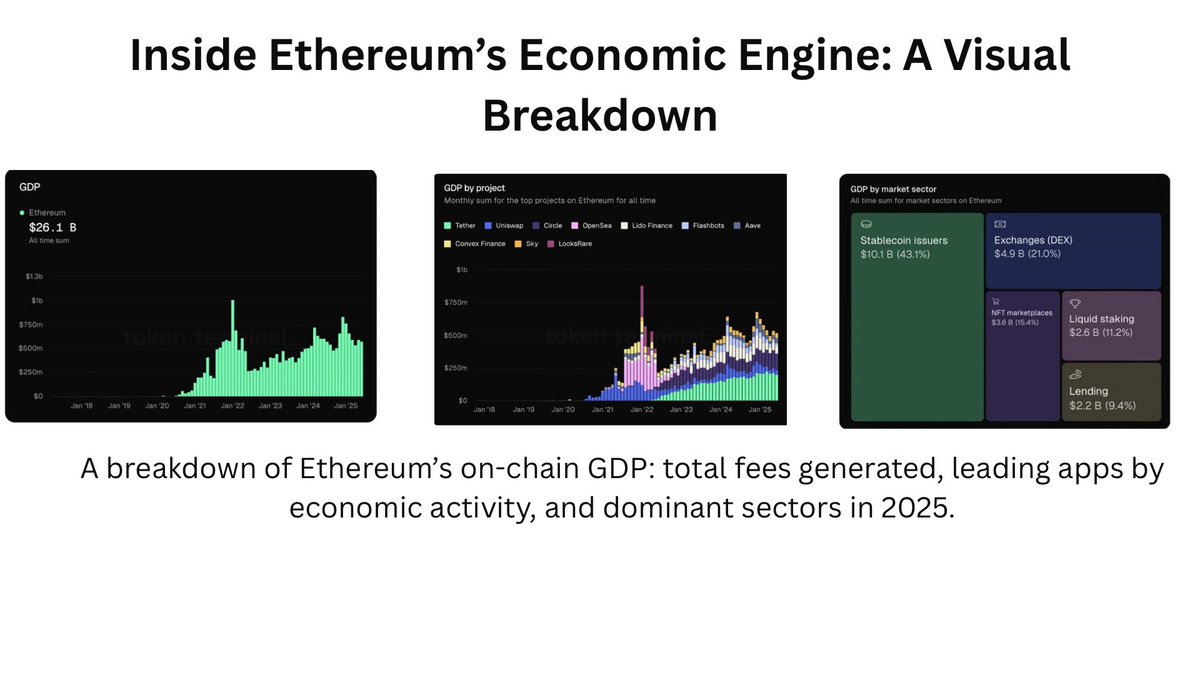 XXX engagements  **Related Topics** [regulatory](/topic/regulatory) [l2](/topic/l2) [ethereum](/topic/ethereum) [coins layer 1](/topic/coins-layer-1) [Post Link](https://x.com/Cryptoguy49/status/1946152784405172238)
[GUEST ACCESS MODE: Data is scrambled or limited to provide examples. Make requests using your API key to unlock full data. Check https://lunarcrush.ai/auth for authentication information.]
 Cryptoguy49 @Cryptoguy49 on x XXX followers
Created: 2025-07-18 10:19:16 UTC
Cryptoguy49 @Cryptoguy49 on x XXX followers
Created: 2025-07-18 10:19:16 UTC
Ethereum touched $XXXXX. A solid bounce. Enough to wake the timeline up again.🧵⬇️
A few months ago, people were memeing its funeral.
It was called “dead tech.” L2 wars, regulatory heat, slow dev cycles the narrative was fading.
So I stepped back and asked what does the data really say?
But then I looked at the data.
Turns out, Ethereum’s economy is doing the exact opposite of dying.
As of early July, Token Terminal reported that the GDP of Ethereum measured in user-paid fees had crossed $XX billion.
And here’s the wild part: 2025 was already shaping up to be its most productive year ever.
What does “Ethereum GDP” even mean?
Token Terminal tracks GDP as the total value of fees paid by users to interact with applications on Ethereum.
Not gas fees. Not protocol revenue. Just raw demand how much end users are actually willing to pay to use things.
Why use fees instead of revenue?
Because some of Ethereum’s most used apps like Uniswap or Morpho have a X% take rate. They don’t generate traditional revenue, but they clearly create massive value and attract real usage.
So fees become a clean signal of where demand flows on-chain.
Stablecoins have taken over Ethereum’s economy
Here’s where it gets interesting.
Back in the 2021–2022 cycle, Ethereum’s top GDP contributors were NFT marketplaces like OpenSea and LooksRare.
But in 2025, there’s been a structural shift.
The top GDP driver now? Stablecoins.
Stablecoin issuers led by Tether (USDT) and Circle (USDC) accounted for:
XX% of Ethereum’s all time GDP XXXX% of Ethereum’s GDP in 2025 alone (as of July)
That’s an insane concentration of activity.
And in the XX days leading up to that report, Tether and Circle had driven more economic activity than the rest of the top XX Ethereum dApps combined.
From JPEGs to real dollars
This shift is more than just numbers it’s a signal.
Ethereum’s economic engine is moving from speculative JPEG trading to dollar based, real-world utility.
Stablecoins = payment rails On-chain FX Institutional adoption Cross border remittance On-chain treasuries
And this is just the start.
In an L2 dominated world, with better UX and lower fees, Ethereum’s GDP might not just grow it might go vertical.
Final thought: The next time someone says Ethereum is dead show them the receipts. Because this isn’t hopium.
It’s on-chain data. @tokenterminal @BitImmortal @simplykashif

XXX engagements

Related Topics regulatory l2 ethereum coins layer 1