[GUEST ACCESS MODE: Data is scrambled or limited to provide examples. Make requests using your API key to unlock full data. Check https://lunarcrush.ai/auth for authentication information.]  Pavlos D ✈️ [@d_pavlos](/creator/twitter/d_pavlos) on x 17K followers Created: 2025-07-17 10:20:02 UTC 📌 Stock Spotlight: $ORCL 🧭 Executive Summary $ORCL has demonstrated robust momentum, closing at $XXXXXX —up +2.70% for the day and continuing to gain +1.20% in extended hours. The stock has broken out above key resistance, riding strong Elliott Wave impulse patterns and maintaining bullish alignment across moving averages. This signals potential continuation in the current uptrend. 🔺 Price Action & Trend Breakout confirmed above a downward-sloping resistance trendline (green). Price closed near all-time highs, above previous resistance around ~$235. The uptrend remains intact within the red ascending channel, suggesting momentum continuation. 📉 Elliott Wave Count Clearly defined Wave X and Wave X structure indicates a completed impulsive sequence. The current price action may be entering a corrective Wave X or Wave B, yet strength above MAs suggests limited downside. 📈 Moving Averages (MA) Short-term (Blue): ~$232.39 Intermediate (Green): ~$222.94 Long-term (Pink): ~$189.18 All MAs are sloping upward and in bullish alignment (short > intermediate > long), reinforcing the uptrend. 🔄 Volume & Momentum Consecutive bullish candles with increasing volume. No signs of bearish divergence visible—momentum indicators likely support the recent move. 💡 Key Takeaways Bullish Setup: The stock has clearly broken out of consolidation and is trending within a strong impulse channel. Support Zone: ~$232–$222; downside likely limited unless price closes below this band. Upside Target: Based on wave structure and channel projection, next potential resistance is in the $260–$275 range. Risk Management: A break below the green trendline or 50-day MA could trigger a deeper correction (~$210–$220 zone). 🧠 Summary $ORCL is in a strong bullish phase, supported by technicals and upward-trending moving averages. Elliott Wave structure suggests it's either completing or has completed a Wave 5, which could introduce a brief corrective pause before the next leg higher. You may consider this a trend continuation opportunity, provided it holds above key MAs and breakout levels. For more insights, visit #ORCL #SPX #SPY #QQQ #Invest #Trading 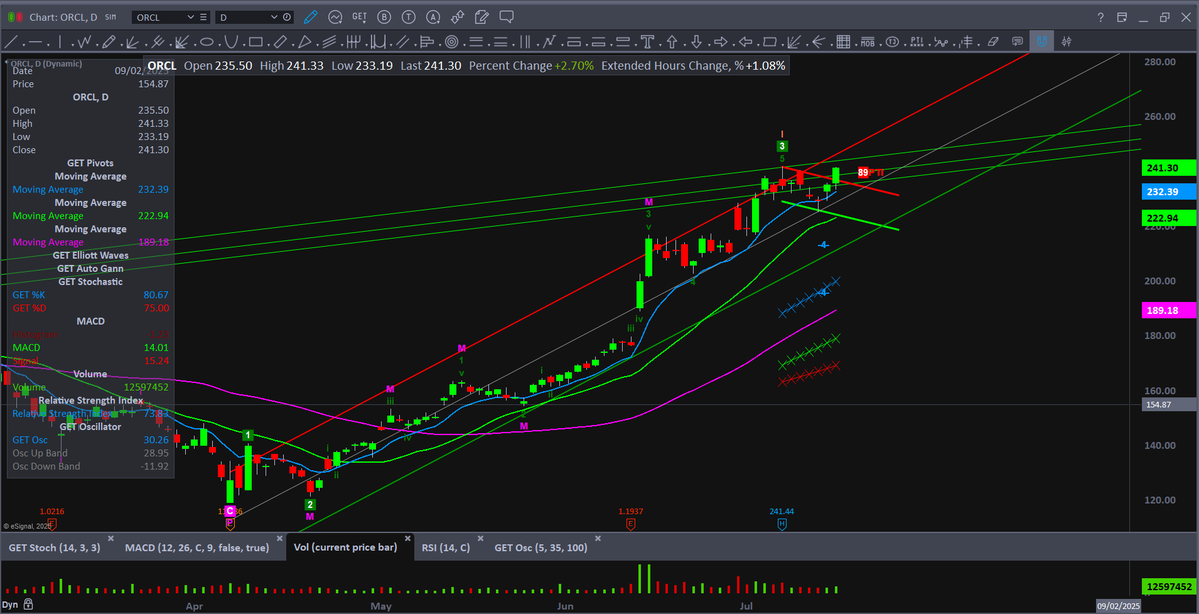 XXX engagements  **Related Topics** [signals](/topic/signals) [momentum](/topic/momentum) [$orcl](/topic/$orcl) [stocks technology](/topic/stocks-technology) [Post Link](https://x.com/d_pavlos/status/1945790590223827150)
[GUEST ACCESS MODE: Data is scrambled or limited to provide examples. Make requests using your API key to unlock full data. Check https://lunarcrush.ai/auth for authentication information.]
 Pavlos D ✈️ @d_pavlos on x 17K followers
Created: 2025-07-17 10:20:02 UTC
Pavlos D ✈️ @d_pavlos on x 17K followers
Created: 2025-07-17 10:20:02 UTC
📌 Stock Spotlight: $ORCL
🧭 Executive Summary
$ORCL has demonstrated robust momentum, closing at $XXXXXX —up +2.70% for the day and continuing to gain +1.20% in extended hours. The stock has broken out above key resistance, riding strong Elliott Wave impulse patterns and maintaining bullish alignment across moving averages. This signals potential continuation in the current uptrend.
🔺 Price Action & Trend Breakout confirmed above a downward-sloping resistance trendline (green).
Price closed near all-time highs, above previous resistance around ~$235. The uptrend remains intact within the red ascending channel, suggesting momentum continuation.
📉 Elliott Wave Count Clearly defined Wave X and Wave X structure indicates a completed impulsive sequence. The current price action may be entering a corrective Wave X or Wave B, yet strength above MAs suggests limited downside. 📈 Moving Averages (MA) Short-term (Blue): ~$232.39 Intermediate (Green): ~$222.94 Long-term (Pink): ~$189.18 All MAs are sloping upward and in bullish alignment (short > intermediate > long), reinforcing the uptrend.
🔄 Volume & Momentum Consecutive bullish candles with increasing volume. No signs of bearish divergence visible—momentum indicators likely support the recent move.
💡 Key Takeaways Bullish Setup: The stock has clearly broken out of consolidation and is trending within a strong impulse channel.
Support Zone: ~$232–$222; downside likely limited unless price closes below this band.
Upside Target: Based on wave structure and channel projection, next potential resistance is in the $260–$275 range.
Risk Management: A break below the green trendline or 50-day MA could trigger a deeper correction (~$210–$220 zone).
🧠 Summary $ORCL is in a strong bullish phase, supported by technicals and upward-trending moving averages. Elliott Wave structure suggests it's either completing or has completed a Wave 5, which could introduce a brief corrective pause before the next leg higher. You may consider this a trend continuation opportunity, provided it holds above key MAs and breakout levels.
For more insights, visit
#ORCL #SPX #SPY #QQQ #Invest #Trading

XXX engagements

Related Topics signals momentum $orcl stocks technology