[GUEST ACCESS MODE: Data is scrambled or limited to provide examples. Make requests using your API key to unlock full data. Check https://lunarcrush.ai/auth for authentication information.]  San.Eth [@Adi_bulls](/creator/twitter/Adi_bulls) on x 5958 followers Created: 2025-07-16 16:28:37 UTC Hey #velorian The chart looking the $VELO/USDT trading pair on a 1-day candlestick timeframe, with the current price at XXXXXXXX USDT, reflecting a XXXX% decrease. Key technical indicators include: MACD (12, 26, 9) The MACD line is at 0.000780, with the signal line (DIF) at XXXXXXXX and a histogram (A) of 0.000634, indicating a potential bullish momentum as the MACD line is above the signal line and rising. Price Action: The candlestick pattern shows an upward trend over the past few days, with higher highs and higher lows, suggesting bullish sentiment. However, the recent slight decline may indicate short-term profit-taking or consolidation. Support and Resistance: The price is near the recent high of 0.018290, which could act as immediate resistance. Support might be found around XXXXXXX (24h low) if the price reverses. Volume: 24-hour. trading volume is 38.384M VELO and 662.367K USDT, indicating moderate market activity supporting the price movement. @veloprotocol 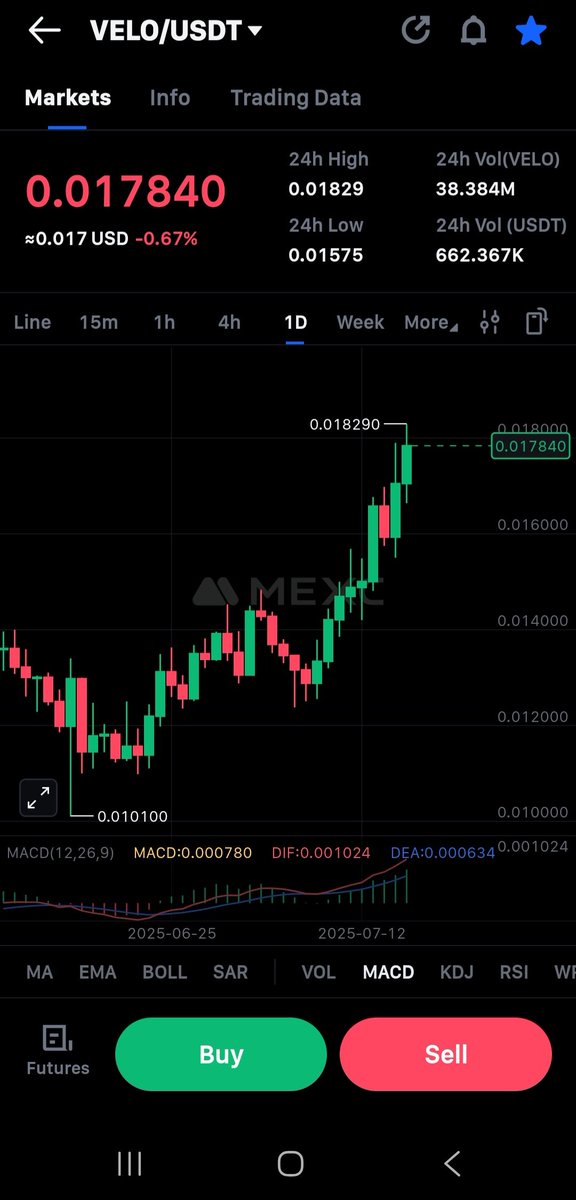 XXX engagements  **Related Topics** [usdt](/topic/usdt) [$velousdt](/topic/$velousdt) [Post Link](https://x.com/Adi_bulls/status/1945520957952774279)
[GUEST ACCESS MODE: Data is scrambled or limited to provide examples. Make requests using your API key to unlock full data. Check https://lunarcrush.ai/auth for authentication information.]
 San.Eth @Adi_bulls on x 5958 followers
Created: 2025-07-16 16:28:37 UTC
San.Eth @Adi_bulls on x 5958 followers
Created: 2025-07-16 16:28:37 UTC
Hey #velorian The chart looking the $VELO/USDT trading pair on a 1-day candlestick timeframe, with the current price at XXXXXXXX USDT, reflecting a XXXX% decrease. Key technical indicators include:
MACD (12, 26, 9) The MACD line is at 0.000780, with the signal line (DIF) at XXXXXXXX and a histogram (A) of 0.000634, indicating a potential bullish momentum as the MACD line is above the signal line and rising. Price Action: The candlestick pattern shows an upward trend over the past few days, with higher highs and higher lows, suggesting bullish sentiment. However, the recent slight decline may indicate short-term profit-taking or consolidation. Support and Resistance: The price is near the recent high of 0.018290, which could act as immediate resistance. Support might be found around XXXXXXX (24h low) if the price reverses. Volume: 24-hour. trading volume is 38.384M VELO and 662.367K USDT, indicating moderate market activity supporting the price movement. @veloprotocol

XXX engagements
