[GUEST ACCESS MODE: Data is scrambled or limited to provide examples. Make requests using your API key to unlock full data. Check https://lunarcrush.ai/auth for authentication information.]  Rene Bruentrup [@fallacyalarm](/creator/twitter/fallacyalarm) on x 9195 followers Created: 2025-07-16 16:14:35 UTC This is one of the most interesting charts right now IMO. It plots $DXY against the 10-Y. They have correlated a lot in the last few years because both depend on US economic growth expectations. I can't say I fully understand the divergence over the last three months. 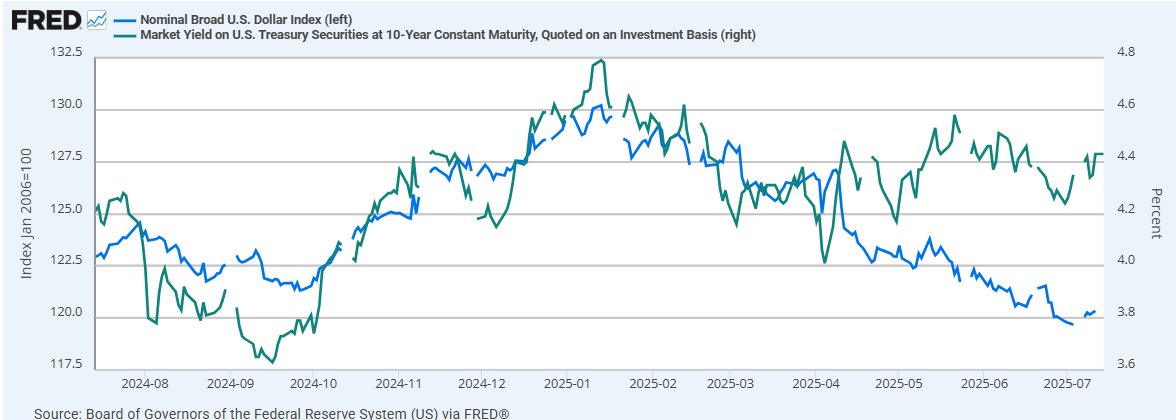 XXXXX engagements  **Related Topics** [$dxy](/topic/$dxy) [imo](/topic/imo) [Post Link](https://x.com/fallacyalarm/status/1945517429276499992)
[GUEST ACCESS MODE: Data is scrambled or limited to provide examples. Make requests using your API key to unlock full data. Check https://lunarcrush.ai/auth for authentication information.]
 Rene Bruentrup @fallacyalarm on x 9195 followers
Created: 2025-07-16 16:14:35 UTC
Rene Bruentrup @fallacyalarm on x 9195 followers
Created: 2025-07-16 16:14:35 UTC
This is one of the most interesting charts right now IMO. It plots $DXY against the 10-Y. They have correlated a lot in the last few years because both depend on US economic growth expectations. I can't say I fully understand the divergence over the last three months.

XXXXX engagements
