[GUEST ACCESS MODE: Data is scrambled or limited to provide examples. Make requests using your API key to unlock full data. Check https://lunarcrush.ai/auth for authentication information.]  $Trader [@GDXTrader](/creator/twitter/GDXTrader) on x 11.5K followers Created: 2025-07-16 12:34:25 UTC $BY6 Member Request $BY6 has been trending in a strong, well-structured uptrend, with the recent pullback finding support right at the 200-day moving average — a key level often defended by longer-term buyers. During the pullback, price carved out a falling wedge, a classic bullish reversal pattern, and is now consolidating just beneath wedge resistance. The technical indicators are starting to align with the setup: the MACD has just crossed above its signal line, and the RSI is showing a bullish divergence, hinting at building momentum beneath the surface. A breakout above the wedge could trigger a fresh leg higher, but traders should stay aware of the declining 50-day moving average overhead, which may act as the next test of resistance. The psychology suggests bulls are positioning for a potential reversal, but confirmation is still needed. $BYND $MCD $SFM $KR $PWLD $TFCF $KKR $PEP $GIS $CHMH $SNAP $NUTR 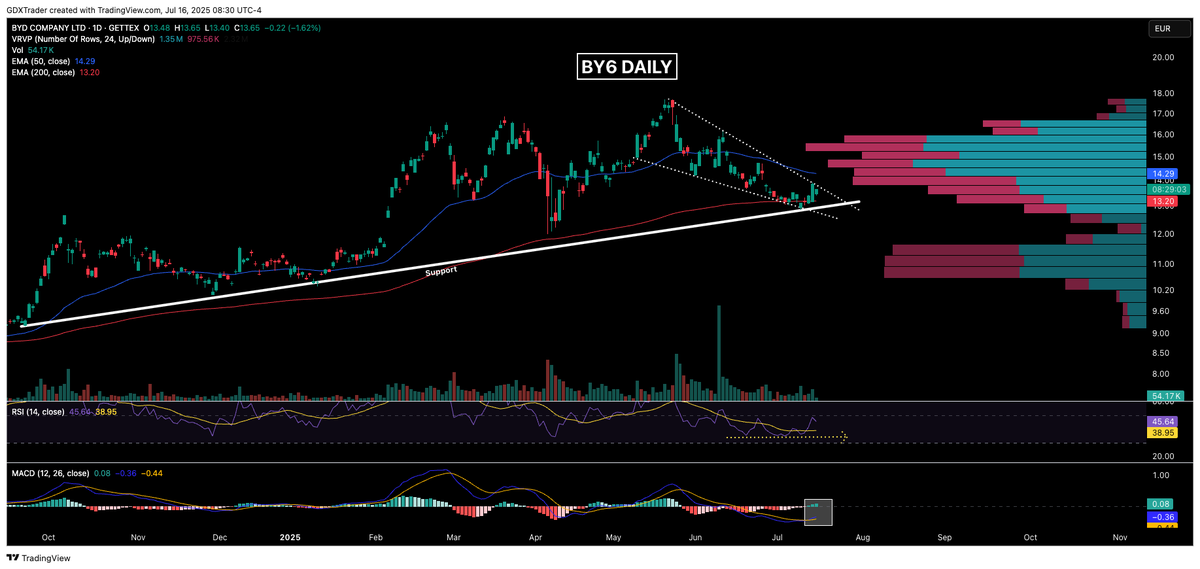 XXX engagements  **Related Topics** [trader](/topic/trader) [reversal](/topic/reversal) [$by6](/topic/$by6) [$trader](/topic/$trader) [Post Link](https://x.com/GDXTrader/status/1945462022776180980)
[GUEST ACCESS MODE: Data is scrambled or limited to provide examples. Make requests using your API key to unlock full data. Check https://lunarcrush.ai/auth for authentication information.]
 $Trader @GDXTrader on x 11.5K followers
Created: 2025-07-16 12:34:25 UTC
$Trader @GDXTrader on x 11.5K followers
Created: 2025-07-16 12:34:25 UTC
$BY6
Member Request
$BY6 has been trending in a strong, well-structured uptrend, with the recent pullback finding support right at the 200-day moving average — a key level often defended by longer-term buyers.
During the pullback, price carved out a falling wedge, a classic bullish reversal pattern, and is now consolidating just beneath wedge resistance.
The technical indicators are starting to align with the setup: the MACD has just crossed above its signal line, and the RSI is showing a bullish divergence, hinting at building momentum beneath the surface.
A breakout above the wedge could trigger a fresh leg higher, but traders should stay aware of the declining 50-day moving average overhead, which may act as the next test of resistance.
The psychology suggests bulls are positioning for a potential reversal, but confirmation is still needed.
$BYND $MCD $SFM $KR $PWLD $TFCF $KKR $PEP $GIS $CHMH $SNAP $NUTR

XXX engagements
