[GUEST ACCESS MODE: Data is scrambled or limited to provide examples. Make requests using your API key to unlock full data. Check https://lunarcrush.ai/auth for authentication information.]  #️⃣ dyor.net [@DyorNetCrypto](/creator/twitter/DyorNetCrypto) on x 84.2K followers Created: 2025-07-14 00:35:43 UTC $TRU / USDT analysis on 1d ### 📊 Price Analysis The price of $TRU has shown a volatile trend, oscillating between highs of around $XXXXXX and recent lows near $XXXXXX. Currently, at $0.0306, it is under pressure due to bearish signals. ### 📈 Trend Overview Despite recent fluctuations, the bearish sentiment remains with a trend score of -XX. The StochRSI indicates overbought conditions, while the ADX at XXXXX suggests a strengthening of the bearish trend. The latest closing price is below key moving averages (MA10 at $0.0265, MA25 at $0.0276), showcasing downward momentum. ### 📉 Support and Resistance Levels Key resistance is noted at $XXXXXX (trendline resistance) and further near $XXXXXX (BB High). Immediate support can be found at $XXXXXX (BB Low). A break below this support could lead to further declines. ### 📊 Summary and Targets Given the current bearish pressure, a target price of $XXXXXX is reasonable, with a potential stop-loss set at $XXXXXX to manage risk effectively. If bullish momentum resurfaces, watch for levels near $XXXXXX as a potential breakout point for further bullish positions. This content is generated by AI and does not constitute investment advice. Do your own research before investing in any asset, and only invest what you can afford to lose. 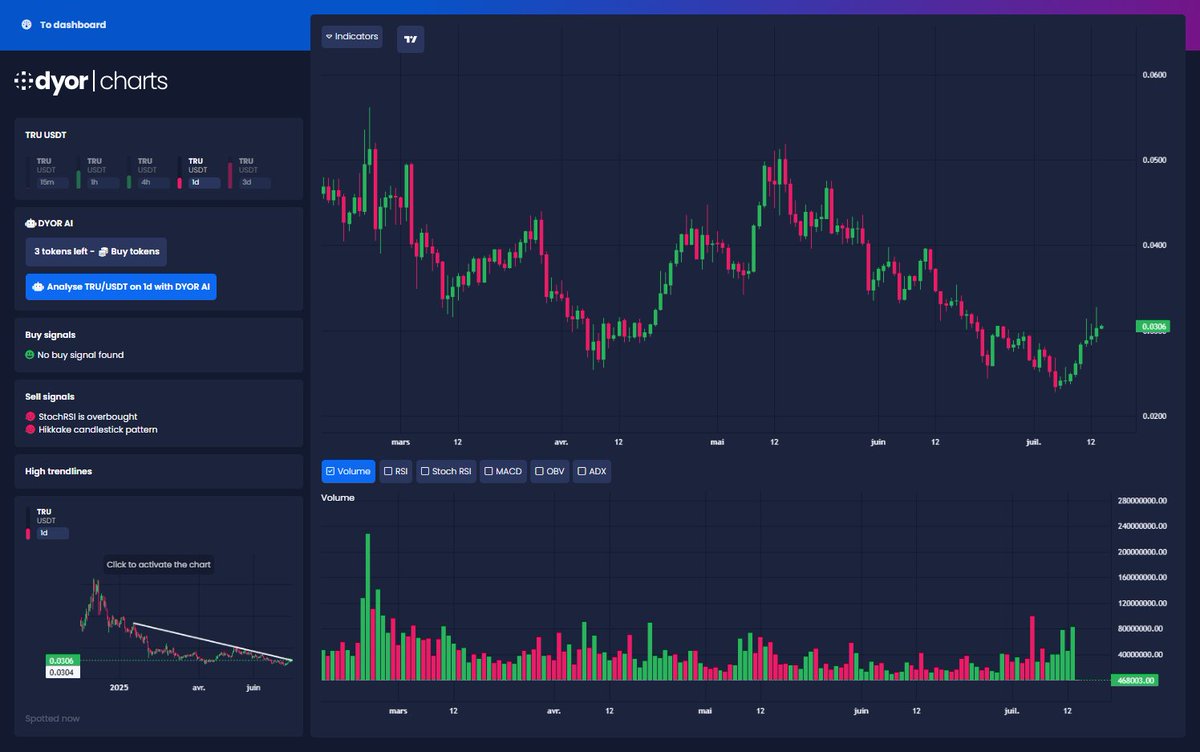 XXX engagements  **Related Topics** [tru](/topic/tru) [Sentiment](/topic/sentiment) [signals](/topic/signals) [bearish](/topic/bearish) [usdt](/topic/usdt) [$tru](/topic/$tru) [tru transunion](/topic/tru-transunion) [stocks industrials](/topic/stocks-industrials) [Post Link](https://x.com/DyorNetCrypto/status/1944556378942853122)
[GUEST ACCESS MODE: Data is scrambled or limited to provide examples. Make requests using your API key to unlock full data. Check https://lunarcrush.ai/auth for authentication information.]
 #️⃣ dyor.net @DyorNetCrypto on x 84.2K followers
Created: 2025-07-14 00:35:43 UTC
#️⃣ dyor.net @DyorNetCrypto on x 84.2K followers
Created: 2025-07-14 00:35:43 UTC
$TRU / USDT analysis on 1d
📊 Price Analysis
The price of $TRU has shown a volatile trend, oscillating between highs of around $XXXXXX and recent lows near $XXXXXX. Currently, at $0.0306, it is under pressure due to bearish signals.
📈 Trend Overview
Despite recent fluctuations, the bearish sentiment remains with a trend score of -XX. The StochRSI indicates overbought conditions, while the ADX at XXXXX suggests a strengthening of the bearish trend. The latest closing price is below key moving averages (MA10 at $0.0265, MA25 at $0.0276), showcasing downward momentum.
📉 Support and Resistance Levels
Key resistance is noted at $XXXXXX (trendline resistance) and further near $XXXXXX (BB High). Immediate support can be found at $XXXXXX (BB Low). A break below this support could lead to further declines.
📊 Summary and Targets
Given the current bearish pressure, a target price of $XXXXXX is reasonable, with a potential stop-loss set at $XXXXXX to manage risk effectively. If bullish momentum resurfaces, watch for levels near $XXXXXX as a potential breakout point for further bullish positions.
This content is generated by AI and does not constitute investment advice. Do your own research before investing in any asset, and only invest what you can afford to lose.

XXX engagements

Related Topics tru Sentiment signals bearish usdt $tru tru transunion stocks industrials