[GUEST ACCESS MODE: Data is scrambled or limited to provide examples. Make requests using your API key to unlock full data. Check https://lunarcrush.ai/auth for authentication information.]  $Trader [@GDXTrader](/creator/twitter/GDXTrader) on x 11.4K followers Created: 2025-07-12 12:09:25 UTC $HAL Member Request Following up on our July 1st post below, where we highlighted $HAL at ascending support with a bullish engulfing candle, the setup played out well for those who took the pivot—bulls stepped in to defend support, and price has since rewarded that move. This week, $HAL reclaimed its 50-day moving average and is now breaking out above the resistance of its symmetrical triangle, confirming a shift in momentum. RSI is rising at 62, showing strengthening bullish pressure, while the MACD continues to expand, indicating increasing upside momentum. From a technical standpoint, a low-volume node on the volume profile just above current price suggests limited supply, which could accelerate the move higher. The next key resistance lies near the 200-day moving average, which becomes a likely target if bullish momentum continues. Just above $25, there's a strong resistance zone, particularly evident on the weekly chart, making it a critical level to watch (see weekly chart). Psychologically, bulls are starting to take back control, and the breakout on the daily may trigger further buying as confidence builds if the breakout holds early next week. $SLB $BKR $NOV $FTI $OIS $DRQ $RES $WTTR $LBRT $PUMP $NBR $PTEN 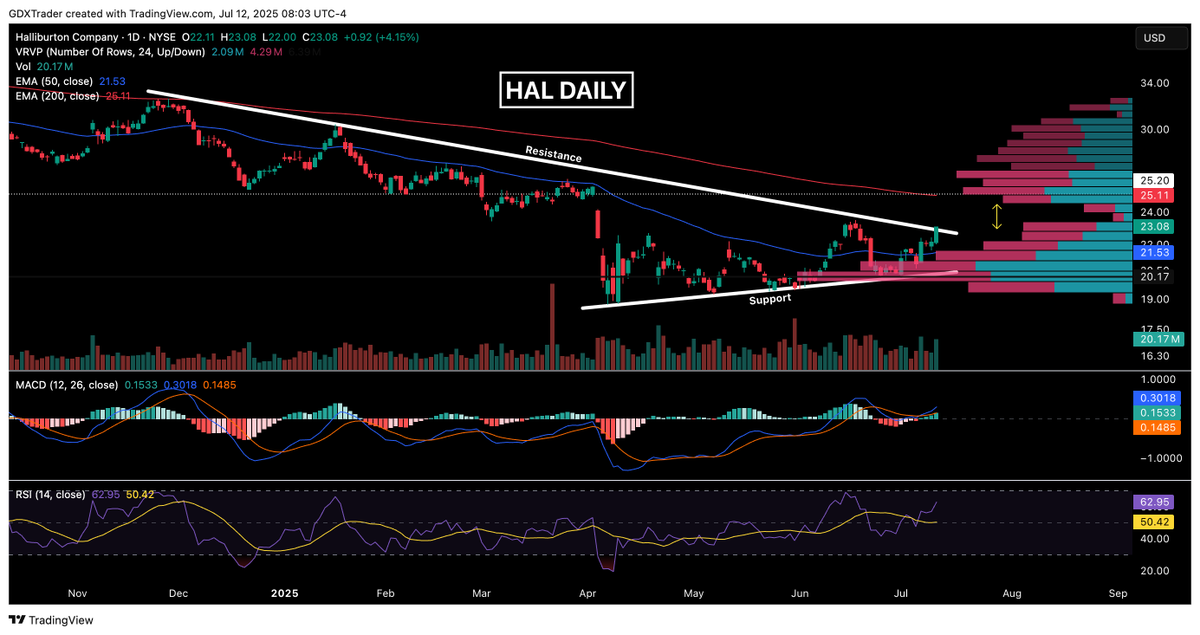 XXXXX engagements  **Related Topics** [stocks defense](/topic/stocks-defense) [candle](/topic/candle) [$hal](/topic/$hal) [$trader](/topic/$trader) [halliburton company](/topic/halliburton-company) [stocks energy](/topic/stocks-energy) [Post Link](https://x.com/GDXTrader/status/1944006178201039107)
[GUEST ACCESS MODE: Data is scrambled or limited to provide examples. Make requests using your API key to unlock full data. Check https://lunarcrush.ai/auth for authentication information.]
 $Trader @GDXTrader on x 11.4K followers
Created: 2025-07-12 12:09:25 UTC
$Trader @GDXTrader on x 11.4K followers
Created: 2025-07-12 12:09:25 UTC
$HAL
Member Request
Following up on our July 1st post below, where we highlighted $HAL at ascending support with a bullish engulfing candle, the setup played out well for those who took the pivot—bulls stepped in to defend support, and price has since rewarded that move.
This week, $HAL reclaimed its 50-day moving average and is now breaking out above the resistance of its symmetrical triangle, confirming a shift in momentum.
RSI is rising at 62, showing strengthening bullish pressure, while the MACD continues to expand, indicating increasing upside momentum.
From a technical standpoint, a low-volume node on the volume profile just above current price suggests limited supply, which could accelerate the move higher.
The next key resistance lies near the 200-day moving average, which becomes a likely target if bullish momentum continues. Just above $25, there's a strong resistance zone, particularly evident on the weekly chart, making it a critical level to watch (see weekly chart).
Psychologically, bulls are starting to take back control, and the breakout on the daily may trigger further buying as confidence builds if the breakout holds early next week.
$SLB $BKR $NOV $FTI $OIS $DRQ $RES $WTTR $LBRT $PUMP $NBR $PTEN

XXXXX engagements

Related Topics stocks defense candle $hal $trader halliburton company stocks energy