[GUEST ACCESS MODE: Data is scrambled or limited to provide examples. Make requests using your API key to unlock full data. Check https://lunarcrush.ai/auth for authentication information.]  #️⃣ dyor.net [@DyorNetCrypto](/creator/twitter/DyorNetCrypto) on x 84.2K followers Created: 2025-07-12 05:35:47 UTC $ONG / USDT analysis on 1d 🚀 **Price Analysis** The current price of $ONG is $0.1938, which shows significant volatility, having peaked recently at $XXXXXX and consolidating around the $XXXXXX mark. Historically, support levels are found at MA200 ($0.2309) and MA100 ($0.1890), while immediate resistance sits at the trendline level of $XXXXXX. 📈 **Trend Assessment** The trend score at -X indicates a neutral stance, leaning slightly bearish despite the bullish signal from SuperTrend. The StochRSI being overbought at XXX suggests potential price pullbacks. ⚡ **Market Momentum** Current indicators show an ADX of 23.32, reflecting average market strength. The RSI at XXXXX underlines bullish momentum but nearing overbought territory can trigger a reversal. 📊 **Price Target & Stop-Loss** A target price of $XXXXXX appears feasible if bullish momentum persists, with a stop-loss set at $XXXXXX to manage risk effectively. Given the present conditions, careful monitoring is essential for traders. This content is generated by AI and does not constitute investment advice. Do your own research before investing in any asset, and only invest what you can afford to lose. 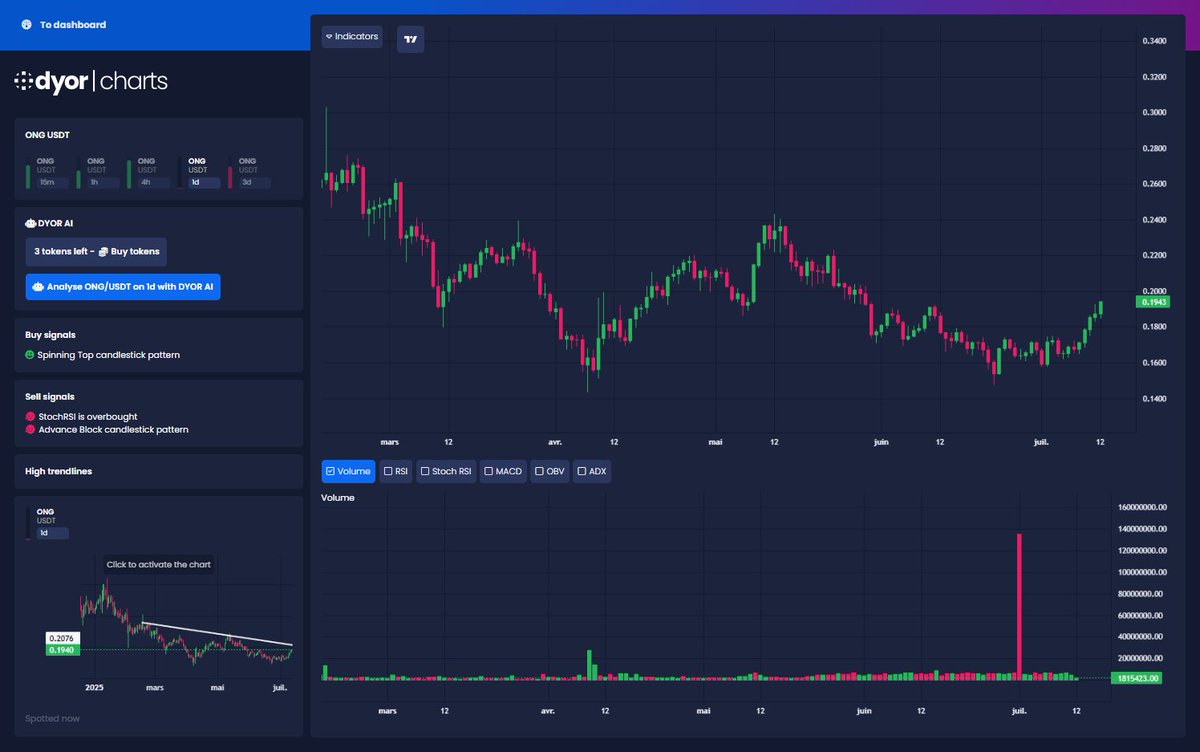 XXX engagements  **Related Topics** [usdt](/topic/usdt) [$ong](/topic/$ong) [ontology gas](/topic/ontology-gas) [coins layer 1](/topic/coins-layer-1) [Post Link](https://x.com/DyorNetCrypto/status/1943907117095596316)
[GUEST ACCESS MODE: Data is scrambled or limited to provide examples. Make requests using your API key to unlock full data. Check https://lunarcrush.ai/auth for authentication information.]
 #️⃣ dyor.net @DyorNetCrypto on x 84.2K followers
Created: 2025-07-12 05:35:47 UTC
#️⃣ dyor.net @DyorNetCrypto on x 84.2K followers
Created: 2025-07-12 05:35:47 UTC
$ONG / USDT analysis on 1d
🚀 Price Analysis The current price of $ONG is $0.1938, which shows significant volatility, having peaked recently at $XXXXXX and consolidating around the $XXXXXX mark. Historically, support levels are found at MA200 ($0.2309) and MA100 ($0.1890), while immediate resistance sits at the trendline level of $XXXXXX.
📈 Trend Assessment The trend score at -X indicates a neutral stance, leaning slightly bearish despite the bullish signal from SuperTrend. The StochRSI being overbought at XXX suggests potential price pullbacks.
⚡ Market Momentum Current indicators show an ADX of 23.32, reflecting average market strength. The RSI at XXXXX underlines bullish momentum but nearing overbought territory can trigger a reversal.
📊 Price Target & Stop-Loss A target price of $XXXXXX appears feasible if bullish momentum persists, with a stop-loss set at $XXXXXX to manage risk effectively. Given the present conditions, careful monitoring is essential for traders.
This content is generated by AI and does not constitute investment advice. Do your own research before investing in any asset, and only invest what you can afford to lose.

XXX engagements

Related Topics usdt $ong ontology gas coins layer 1