[GUEST ACCESS MODE: Data is scrambled or limited to provide examples. Make requests using your API key to unlock full data. Check https://lunarcrush.ai/auth for authentication information.]  King Wabi (Mr Big Business) [@KingWabii](/creator/twitter/KingWabii) on x 18.5K followers Created: 2025-07-11 03:38:44 UTC I WILL BE ONE OF THE FEW VOICES OF REASON ON CT! $BTC IS NOT DONE YET ! #BITCOIN HAS MUCH FURTHER TO GO ON ITS USD PAIR! EVERYONE! PAY ATTENTION AND LISTEN UP NOW!I'VE GOT MAJOR ALPHA FOR YOU WITH AN EXCLUSIVE CHART WHICH WILL PROVIDE YOU ALL WITH CLARITY! LETS DEEP DIVE CONT--.. As discussed on my earlier posts, the MACD is one of the ULTIMATE INDICATORS to show how strong or weak an overall assets trend is at the moment. As you'll see on the chart ive curated for you all, the MACD is lower that when Bitcoin reached many of its local highs at 74k/ 108k / and at 111k all after the MACD went towards low levels. Right now $BTC is now showing it's first higher low on the MACD after reaching DEPRESSED levels not seen since FTX! This would indicate HUGE confirmation that $BTC still has lots of juice left in it! Furthermore, we've got some KEY MOVING AVERAGES that showcase INSANE moves once they cross. Now you might be asking "how are these levels important Wabi?!" THEY ARE SIMPLY MOVING AVERAGES RIGHT!? Theres NO WAY they can provide confluence or even a hit of alpha! Ladies and gentlemen, this is where Mr. Market comes in and does his magic. We only use TA and SOME indicators to back up our analysis, but i have found some CLEAN ALPHA that suggest that $BTC can rally a MINIMUM of 35-50% from our recent higher low of XX. Displayed are the XXX and XXX daily moving averages which are THE MOST important signals of a full bullish momentum shift. I have outline what happens to the Bitcoin price when these moving averages converge and curl up to the upside. The examples which are shown all start from the bottom left, so please observe this chart from it's entire perspective so that are able to grasp the full analysis as i guide you through all examples. 1rst example - XXX day ema and XXX day ema cross at 31k btc in q4 of 2023 = over XX% rally over the next X months to 48k. You will all remember just how tough it was for $BTC to cross 31k during 2023! It was an awesome accomplishment after an X month battle! During this time fresh new coins like $TIA + other fresh VC coins came out the gate and pulled off XXX% gains! even coins like $AVAX and $SEI rallied by over XXX % in weeks. 2nd example- XXX day ema and XXX day ema cross at the higher low formed at 41k btc = over XX % rally over the next X months to 74k after struggling to get passed 45-48k for a few weeks. Onchain started to pick up MASSIVELY and $PEPE started to give signal to the entire altcoin market. 3rd example- XXX day ema and XXX day ema cross at 65k leading up to the election and we went to have an over XX% rally towards XXX. While onchain alts started to take life, specifically things like #spx6900 , $fartcoin and ai coins such as $virtual 4rth example - XXX day and XXX day ema cross during our higher low formation at 98k. A simple measured move in comparing previous market environments would suggest an explosive move to a minimum of 130k. At the moment coins like $BONK , $USELESS and $LAUNCOIN are catching massive attention. All of this during a historical recovery from the stock market. So not only do we have the $IWM + lowcap stocks doing well and a similar risk on environment we havent had in a while.. we've also got some incredible and historic indicators for $BTC to tread higher and higher. We are all blessed to be here. It is only a matter of time before altcoin degens start to also rotate gains into $BTC longs to take this baby higher. I hope you all enjoyed this post and i hope it gives some clarity amongst the chaos on the timeline at this very moment Feel free to share this post or drop a like and a comment. I've been trying my best to provide some actionable alpha rather than watered down 2021 shit post copy pastas or just saying " up only be ready" Thank you all for following me and supporting my content it truly means the world. tagging some chads down below!! @MaxBecauseBTC @_edwardornelas @DonnyDicey @BigCheds @i_am_jackis @Trader_XO @trader1sz @docXBT @WillsOutlook @apewoodx @iruletrenches @mithcoons @ChillTRD @koolcryptovc @web3pingu @ColdBloodShill @LomahCrypto 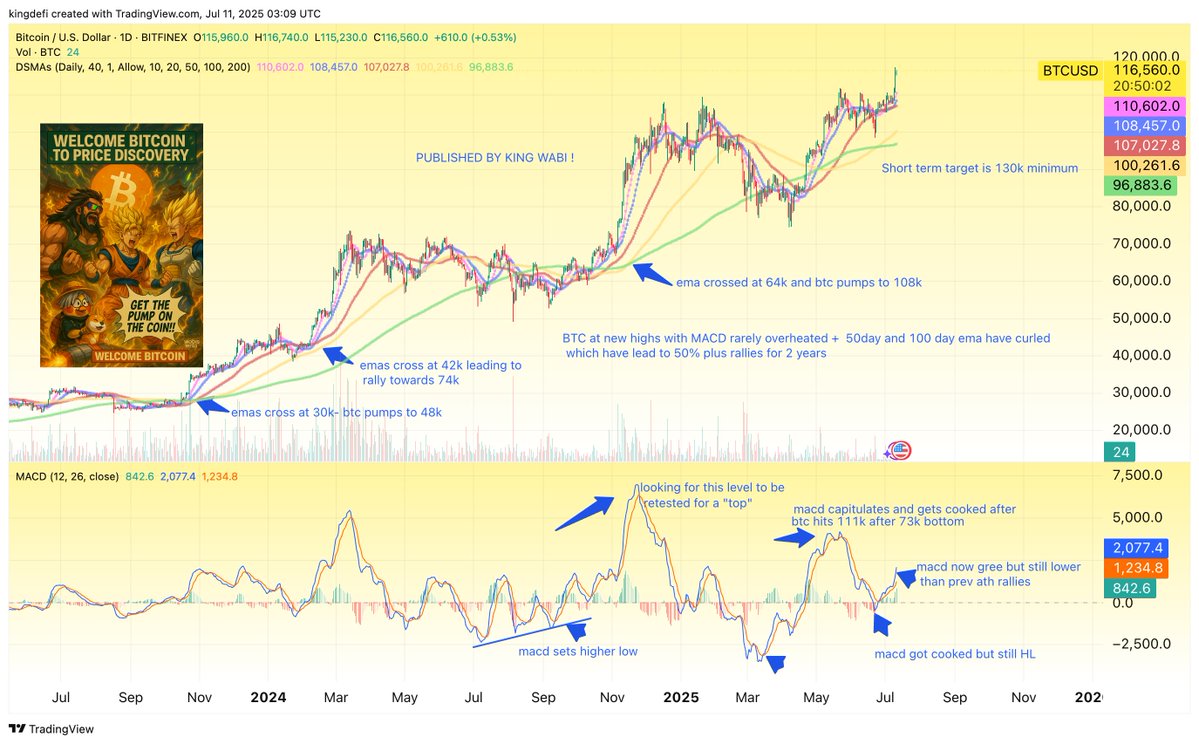 XXXXX engagements  **Related Topics** [deep dive](/topic/deep-dive) [clarity](/topic/clarity) [united states dollar](/topic/united-states-dollar) [#bitcoin](/topic/#bitcoin) [$btc](/topic/$btc) [bitcoin](/topic/bitcoin) [coins layer 1](/topic/coins-layer-1) [coins bitcoin ecosystem](/topic/coins-bitcoin-ecosystem) [Post Link](https://x.com/KingWabii/status/1943515272297447761)
[GUEST ACCESS MODE: Data is scrambled or limited to provide examples. Make requests using your API key to unlock full data. Check https://lunarcrush.ai/auth for authentication information.]
 King Wabi (Mr Big Business) @KingWabii on x 18.5K followers
Created: 2025-07-11 03:38:44 UTC
King Wabi (Mr Big Business) @KingWabii on x 18.5K followers
Created: 2025-07-11 03:38:44 UTC
I WILL BE ONE OF THE FEW VOICES OF REASON ON CT! $BTC IS NOT DONE YET ! #BITCOIN HAS MUCH FURTHER TO GO ON ITS USD PAIR!
EVERYONE! PAY ATTENTION AND LISTEN UP NOW!I'VE GOT MAJOR ALPHA FOR YOU WITH AN EXCLUSIVE CHART WHICH WILL PROVIDE YOU ALL WITH CLARITY!
LETS DEEP DIVE CONT--..
As discussed on my earlier posts, the MACD is one of the ULTIMATE INDICATORS to show how strong or weak an overall assets trend is at the moment. As you'll see on the chart ive curated for you all, the MACD is lower that when Bitcoin reached many of its local highs at 74k/ 108k / and at 111k all after the MACD went towards low levels.
Right now $BTC is now showing it's first higher low on the MACD after reaching DEPRESSED levels not seen since FTX! This would indicate HUGE confirmation that $BTC still has lots of juice left in it! Furthermore, we've got some KEY MOVING AVERAGES that showcase INSANE moves once they cross.
Now you might be asking "how are these levels important Wabi?!" THEY ARE SIMPLY MOVING AVERAGES RIGHT!? Theres NO WAY they can provide confluence or even a hit of alpha!
Ladies and gentlemen, this is where Mr. Market comes in and does his magic. We only use TA and SOME indicators to back up our analysis, but i have found some CLEAN ALPHA that suggest that $BTC can rally a MINIMUM of 35-50% from our recent higher low of XX.
Displayed are the XXX and XXX daily moving averages which are THE MOST important signals of a full bullish momentum shift. I have outline what happens to the Bitcoin price when these moving averages converge and curl up to the upside.
The examples which are shown all start from the bottom left, so please observe this chart from it's entire perspective so that are able to grasp the full analysis as i guide you through all examples.
1rst example -
XXX day ema and XXX day ema cross at 31k btc in q4 of 2023 = over XX% rally over the next X months to 48k. You will all remember just how tough it was for $BTC to cross 31k during 2023! It was an awesome accomplishment after an X month battle!
During this time fresh new coins like $TIA + other fresh VC coins came out the gate and pulled off XXX% gains!
even coins like $AVAX and $SEI rallied by over XXX % in weeks.
2nd example-
XXX day ema and XXX day ema cross at the higher low formed at 41k btc = over XX % rally over the next X months to 74k after struggling to get passed 45-48k for a few weeks. Onchain started to pick up MASSIVELY and $PEPE started to give signal to the entire altcoin market.
3rd example-
XXX day ema and XXX day ema cross at 65k leading up to the election and we went to have an over XX% rally towards XXX. While onchain alts started to take life, specifically things like #spx6900 , $fartcoin and ai coins such as $virtual
4rth example -
XXX day and XXX day ema cross during our higher low formation at 98k. A simple measured move in comparing previous market environments would suggest an explosive move to a minimum of 130k. At the moment coins like $BONK , $USELESS and $LAUNCOIN are catching massive attention. All of this during a historical recovery from the stock market.
So not only do we have the $IWM + lowcap stocks doing well and a similar risk on environment we havent had in a while.. we've also got some incredible and historic indicators for $BTC to tread higher and higher.
We are all blessed to be here.
It is only a matter of time before altcoin degens start to also rotate gains into $BTC longs to take this baby higher.
I hope you all enjoyed this post and i hope it gives some clarity amongst the chaos on the timeline at this very moment
Feel free to share this post or drop a like and a comment. I've been trying my best to provide some actionable alpha rather than watered down 2021 shit post copy pastas or just saying " up only be ready"
Thank you all for following me and supporting my content it truly means the world.
tagging some chads down below!!
@MaxBecauseBTC
@_edwardornelas
@DonnyDicey
@BigCheds
@i_am_jackis
@Trader_XO
@trader1sz
@docXBT
@WillsOutlook
@apewoodx
@iruletrenches
@mithcoons
@ChillTRD
@koolcryptovc
@web3pingu
@ColdBloodShill
@LomahCrypto

XXXXX engagements

Related Topics deep dive clarity united states dollar #bitcoin $btc bitcoin coins layer 1 coins bitcoin ecosystem