[GUEST ACCESS MODE: Data is scrambled or limited to provide examples. Make requests using your API key to unlock full data. Check https://lunarcrush.ai/auth for authentication information.]  Benzinga [@Benzinga](/creator/twitter/Benzinga) on x 305.7K followers Created: 2025-07-08 12:59:53 UTC The Buffett Indicator, a metric Warren Buffett once called the best gauge of market valuation, is flashing red again. It measures the total value of the U.S. stock market relative to GDP. As of July 3, the broader Wilshire 5000-based version hit XXX percent. A narrower S&P XXX version stands at XXX percent—both far above historical norms. Traditionally, levels above XXX percent suggest overvaluation. Above XXX percent is considered highly overvalued. But despite these warnings, stocks continue to surge. The S&P XXX is now above XXXXX points, up nearly XX percent since October 2023. Even over the last seven years, the Buffett Indicator has been elevated while the market kept climbing. Why hasn’t the signal worked? Low real interest rates, continued government spending, and the dominance of profitable tech giants have changed how the market responds to valuations. Investors who sold based on the indicator missed one of the strongest bull markets in history. Still, the warning shouldn’t be ignored. While not useful for short-term timing, stretched valuations often lead to long-term mean reversion. The market may keep running, but history suggests that gravity could eventually catch up. The chart confirms this disconnect: stocks look expensive, but the rally hasn’t slowed. 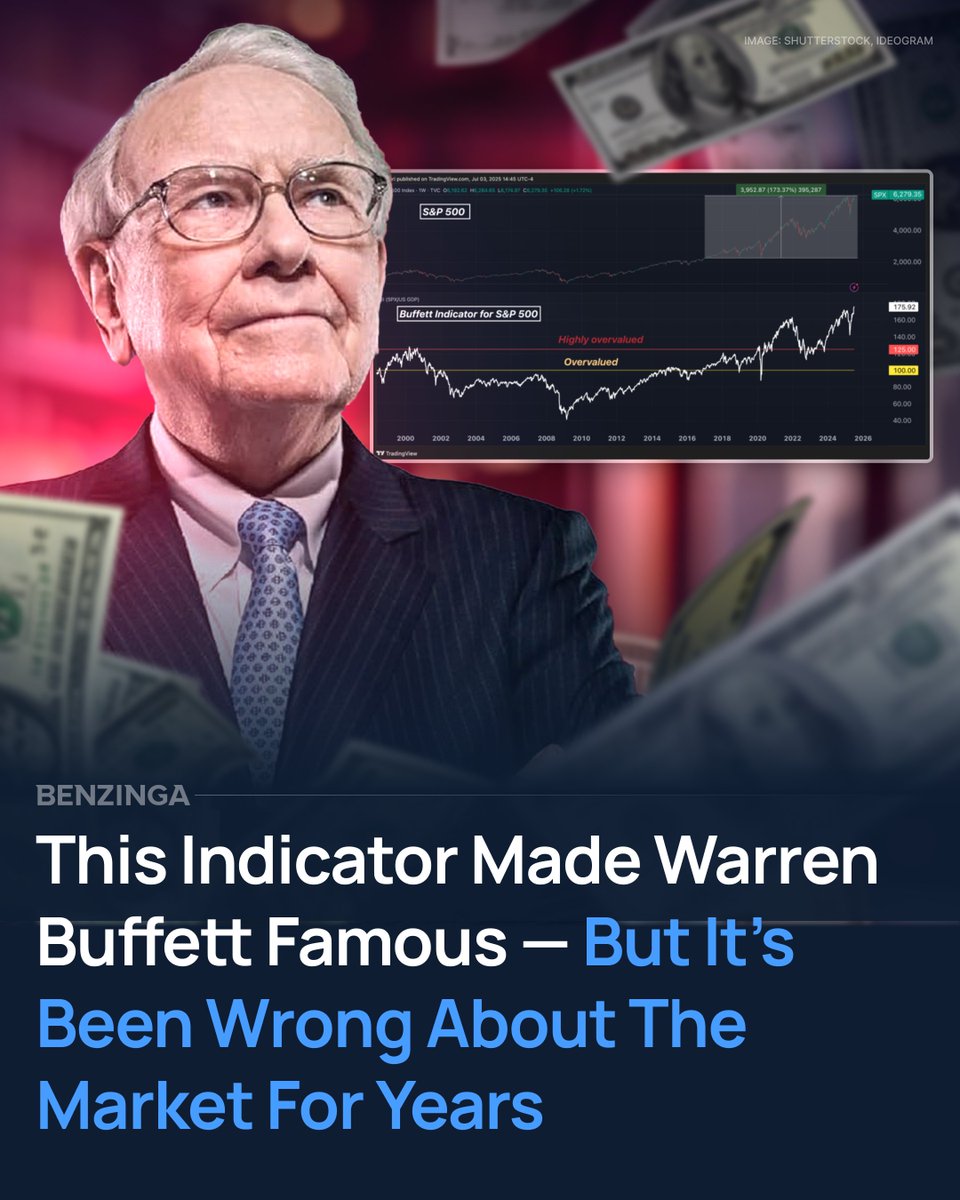 XXXXX engagements  **Related Topics** [rating agency](/topic/rating-agency) [gdp](/topic/gdp) [stocks](/topic/stocks) [warren buffett](/topic/warren-buffett) [$spy](/topic/$spy) [Post Link](https://x.com/Benzinga/status/1942569326998851974)
[GUEST ACCESS MODE: Data is scrambled or limited to provide examples. Make requests using your API key to unlock full data. Check https://lunarcrush.ai/auth for authentication information.]
 Benzinga @Benzinga on x 305.7K followers
Created: 2025-07-08 12:59:53 UTC
Benzinga @Benzinga on x 305.7K followers
Created: 2025-07-08 12:59:53 UTC
The Buffett Indicator, a metric Warren Buffett once called the best gauge of market valuation, is flashing red again. It measures the total value of the U.S. stock market relative to GDP.
As of July 3, the broader Wilshire 5000-based version hit XXX percent. A narrower S&P XXX version stands at XXX percent—both far above historical norms.
Traditionally, levels above XXX percent suggest overvaluation. Above XXX percent is considered highly overvalued. But despite these warnings, stocks continue to surge.
The S&P XXX is now above XXXXX points, up nearly XX percent since October 2023. Even over the last seven years, the Buffett Indicator has been elevated while the market kept climbing.
Why hasn’t the signal worked? Low real interest rates, continued government spending, and the dominance of profitable tech giants have changed how the market responds to valuations.
Investors who sold based on the indicator missed one of the strongest bull markets in history. Still, the warning shouldn’t be ignored.
While not useful for short-term timing, stretched valuations often lead to long-term mean reversion. The market may keep running, but history suggests that gravity could eventually catch up.
The chart confirms this disconnect: stocks look expensive, but the rally hasn’t slowed.

XXXXX engagements

Related Topics rating agency gdp stocks warren buffett $spy