[GUEST ACCESS MODE: Data is scrambled or limited to provide examples. Make requests using your API key to unlock full data. Check https://lunarcrush.ai/auth for authentication information.]  JA Schwab, Chart Czar 🇺🇸 [@schwalbtrader](/creator/twitter/schwalbtrader) on x 2335 followers Created: 2025-04-11 16:14:55 UTC Watch $SH (ProShares Short S&P XXX ETF) for clues on the market. Weekly chart shows SH (red) up XX% from its 2/19/25 low, hitting a rare overbought RSI (>70) for only the 3rd time since 2006— Sept 2008 & March 2020, with X other periods getting very close. Historically, SH overbought signals (e.g., 2008, 2011, 2020, 2022) often precede major SPX lows—but timing varies. Some bottoms came fast (Dec 2018, March 2020); others took months with more volatility (Sept 2008: 6-month wait). Key takeaway: A durable SPX bottom will come, but it may not be immediate. Watch for SH’s weekly RSI to retreat from overbought levels as a sign bearish momentum is fading, setting the stage for SPX recovery. Patience is key but we’re in a bear market environment so more volatility may be ahead. Source: @FrankCappelleri 📉📈 #Markets #SPX #BearMarket 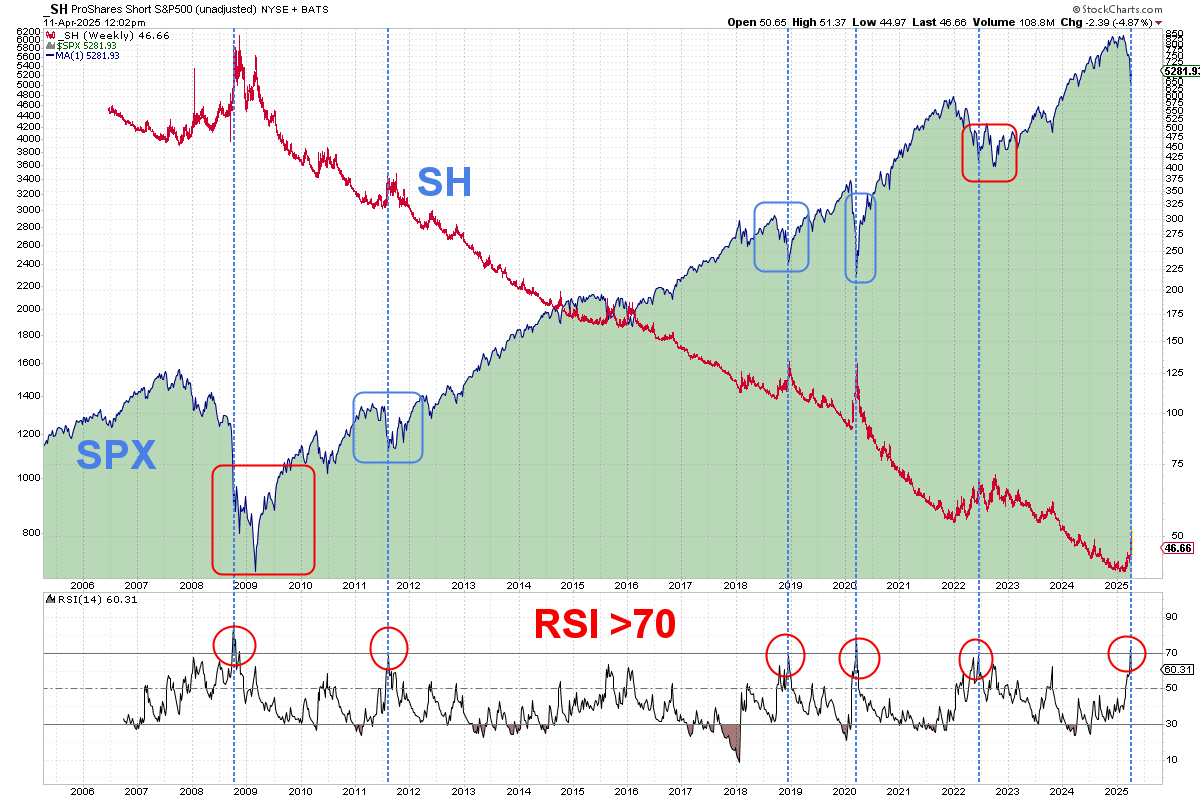 XXX engagements  **Related Topics** [spx](/topic/spx) [signals](/topic/signals) [fund manager](/topic/fund-manager) [rating agency](/topic/rating-agency) [$sh](/topic/$sh) [$spy](/topic/$spy) [Post Link](https://x.com/schwalbtrader/status/1910728278765428922)
[GUEST ACCESS MODE: Data is scrambled or limited to provide examples. Make requests using your API key to unlock full data. Check https://lunarcrush.ai/auth for authentication information.]
 JA Schwab, Chart Czar 🇺🇸 @schwalbtrader on x 2335 followers
Created: 2025-04-11 16:14:55 UTC
JA Schwab, Chart Czar 🇺🇸 @schwalbtrader on x 2335 followers
Created: 2025-04-11 16:14:55 UTC
Watch $SH (ProShares Short S&P XXX ETF) for clues on the market.
Weekly chart shows SH (red) up XX% from its 2/19/25 low, hitting a rare overbought RSI (>70) for only the 3rd time since 2006— Sept 2008 & March 2020, with X other periods getting very close.
Historically, SH overbought signals (e.g., 2008, 2011, 2020, 2022) often precede major SPX lows—but timing varies. Some bottoms came fast (Dec 2018, March 2020); others took months with more volatility (Sept 2008: 6-month wait).
Key takeaway: A durable SPX bottom will come, but it may not be immediate. Watch for SH’s weekly RSI to retreat from overbought levels as a sign bearish momentum is fading, setting the stage for SPX recovery.
Patience is key but we’re in a bear market environment so more volatility may be ahead.
Source: @FrankCappelleri
📉📈 #Markets #SPX #BearMarket

XXX engagements

Related Topics spx signals fund manager rating agency $sh $spy