[GUEST ACCESS MODE: Data is scrambled or limited to provide examples. Make requests using your API key to unlock full data. Check https://lunarcrush.ai/auth for authentication information.]  Prof [@Prof_heist](/creator/twitter/Prof_heist) on x 51.4K followers Created: 2024-08-29 23:59:57 UTC Educational tweet on $EOSE : Weekly chart For nearly a year, this stock traded within a defined channel, but in June 2024, we saw a significant shift. A high-volume candle appeared right before a breakout, signaling a potential change in trend. This was followed by continuation in buying volume the following two weeks. After the breakout, we observed a retest on reduced volume, a healthy sign indicating that sellers were weakening. Buyers then stepped in, held their ground, and regained control, driving the stock to new highs for 2024. This price action suggests a productive movement, with the next targets at $XXXX and, beyond that, $XXXX. 📊🚀 We saw a Pattern + Accumulation + Volume . ✍️ I dont like complicated analysis any more. I focus on candlesticks, volume, patterns. Those are my top X daily go to. I hope this helps if it does then share it with friends here. I will do more of these going forward to help as many of you as I can. 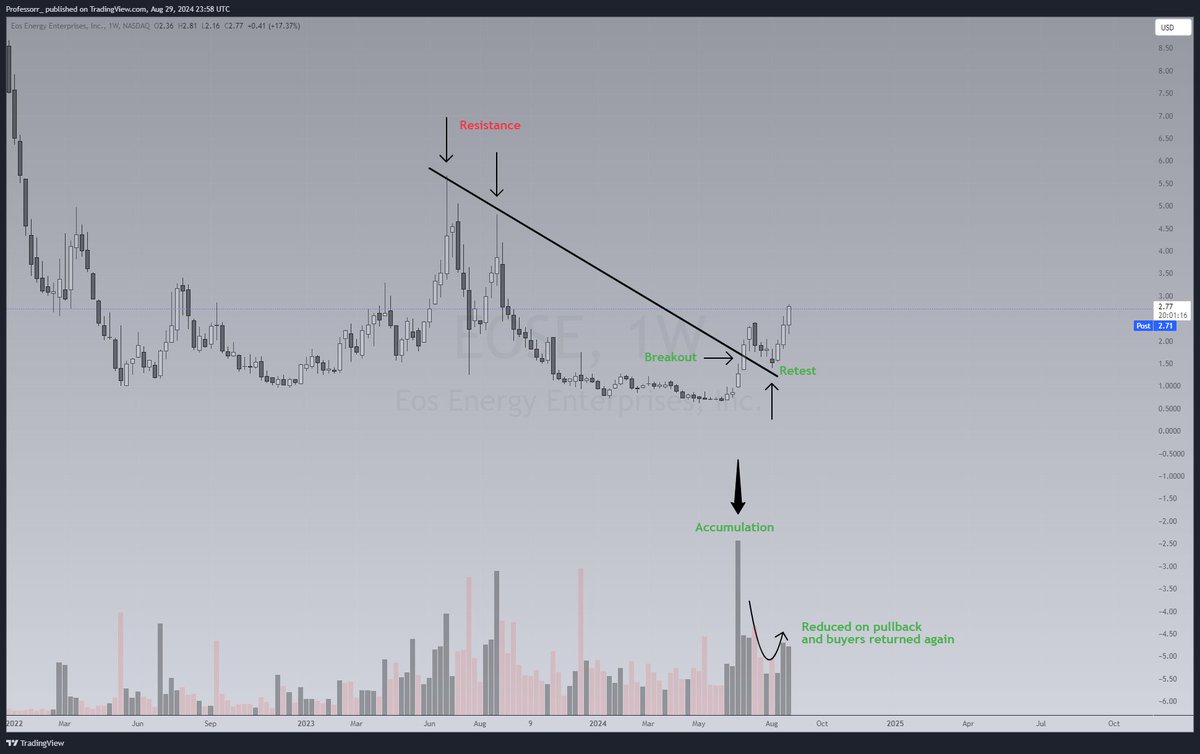 XXXXXX engagements  **Related Topics** [$eose](/topic/$eose) [stocks energy](/topic/stocks-energy) [Post Link](https://x.com/Prof_heist/status/1829308035778424977)
[GUEST ACCESS MODE: Data is scrambled or limited to provide examples. Make requests using your API key to unlock full data. Check https://lunarcrush.ai/auth for authentication information.]
 Prof @Prof_heist on x 51.4K followers
Created: 2024-08-29 23:59:57 UTC
Prof @Prof_heist on x 51.4K followers
Created: 2024-08-29 23:59:57 UTC
Educational tweet on $EOSE : Weekly chart
For nearly a year, this stock traded within a defined channel, but in June 2024, we saw a significant shift. A high-volume candle appeared right before a breakout, signaling a potential change in trend. This was followed by continuation in buying volume the following two weeks.
After the breakout, we observed a retest on reduced volume, a healthy sign indicating that sellers were weakening. Buyers then stepped in, held their ground, and regained control, driving the stock to new highs for 2024.
This price action suggests a productive movement, with the next targets at $XXXX and, beyond that, $XXXX. 📊🚀
We saw a Pattern + Accumulation + Volume . ✍️ I dont like complicated analysis any more. I focus on candlesticks, volume, patterns. Those are my top X daily go to.
I hope this helps if it does then share it with friends here. I will do more of these going forward to help as many of you as I can.

XXXXXX engagements

Related Topics $eose stocks energy