[GUEST ACCESS MODE: Data is scrambled or limited to provide examples. Make requests using your API key to unlock full data. Check https://lunarcrush.ai/auth for authentication information.]
 Maverick Equity Research @Maverick_Equity on x 8943 followers
Created: 2025-07-27 21:17:18 UTC
Maverick Equity Research @Maverick_Equity on x 8943 followers
Created: 2025-07-27 21:17:18 UTC
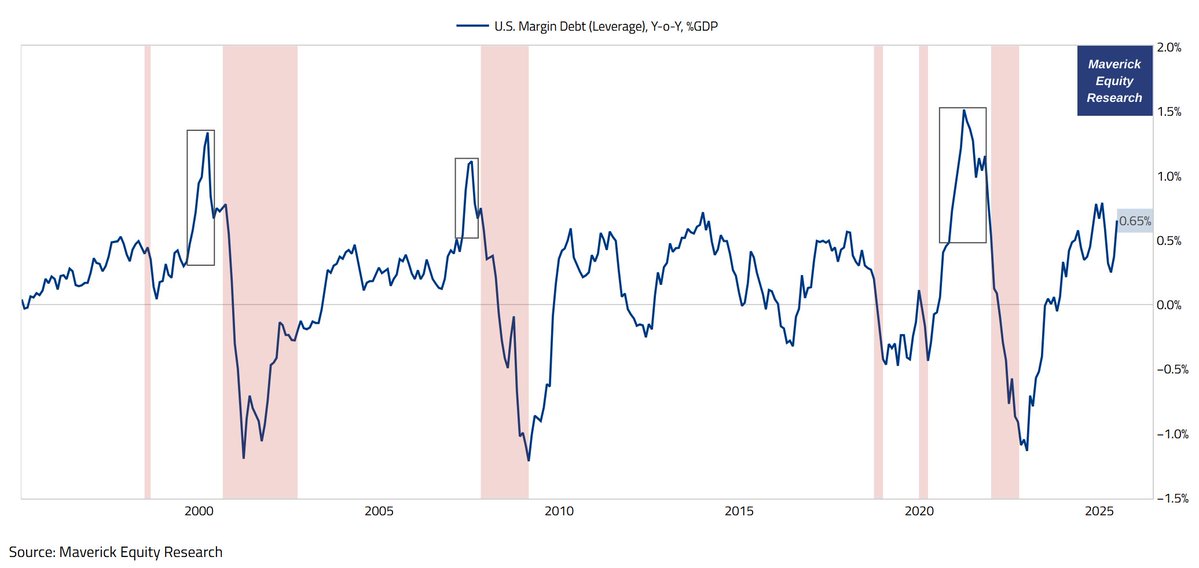
Chart X = Margin Debt change to GDP (Y/Y, %GDP), going funky/wonky here:
👉 more is needed to reach troublesome signalling territory, yet to check for big spikes into local tops as before = a pattern happening before equities drawdowns (check the boxes = pun intended)
Way more on this in a future Maverick Equities Special Report ... free to subscribe = free to get! Cheers!
With respect,
Mav
XXX engagements
