[GUEST ACCESS MODE: Data is scrambled or limited to provide examples. Make requests using your API key to unlock full data. Check https://lunarcrush.ai/auth for authentication information.]
 CrediBULL Crypto @CredibleCrypto on x 473.8K followers
Created: 2025-07-27 00:53:46 UTC
CrediBULL Crypto @CredibleCrypto on x 473.8K followers
Created: 2025-07-27 00:53:46 UTC
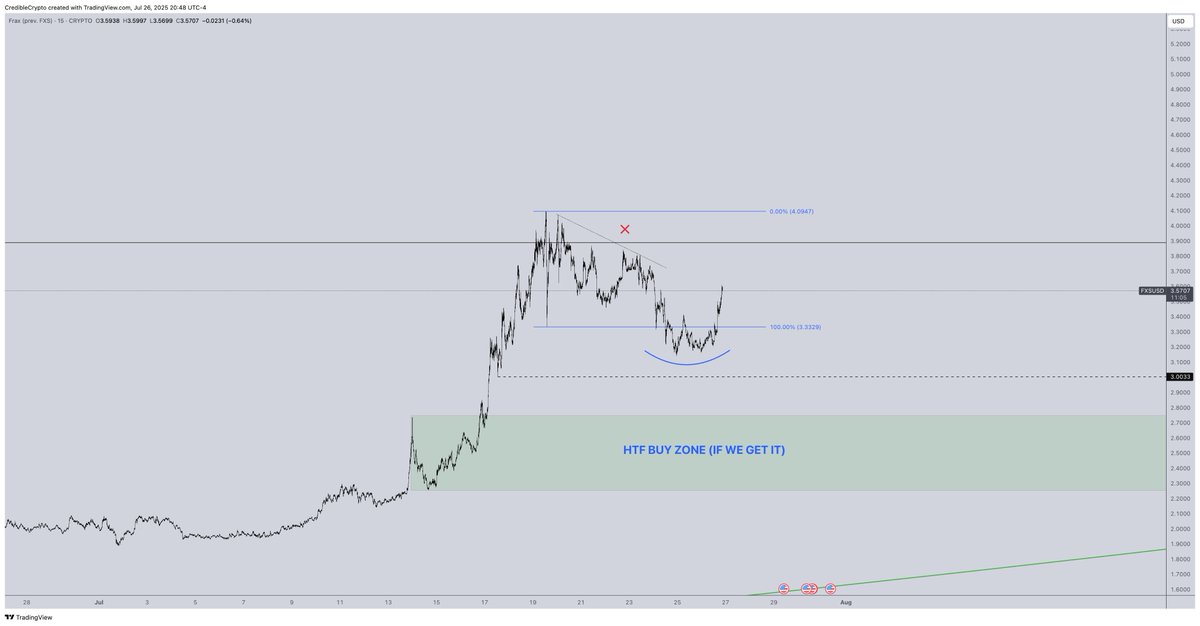
We already know the HTF chart on $FXS is clean af and at this time we are simply taking advantage of the discount to establish a nice spot position for the mid/long term.
So for now, we look at the lower timeframes to try and establish areas of interest to accumulate further before markup begins.
For now, I am watching this LTF range and the area in green below it. Not sure if we will get it, but nothing would please me more than getting another push into the GREEN zone for a chance to pick up more spot.
At the same time, we look to have printed a deviation of the lows of our LTF range, and we have a bunch of untapped local highs, so a move to this smaller range highs is simply a matter of when not if imo.
If the deviation holds then we can expect local range highs next, and it's possible that from there we see expansion into the HIGHER timeframe range (and the start of markup). If however the deviation doesn't hold, then we may be blessed with a return to the HTF BUY ZONE.
Let's see how things develop.
XXXXXXX engagements

Related Topics fxs $fxs coins defi coins made in usa coins bsc coins solana ecosystem coins dao coins arbitrum