[GUEST ACCESS MODE: Data is scrambled or limited to provide examples. Make requests using your API key to unlock full data. Check https://lunarcrush.ai/auth for authentication information.]
 Astro Zan @alshfaw on x 10.5K followers
Created: 2025-07-26 16:45:00 UTC
Astro Zan @alshfaw on x 10.5K followers
Created: 2025-07-26 16:45:00 UTC
$SPY Weekend Technical Analysis by Zan.
- Friday PM about $X millions ⚠️ $XXX SPY calls for 08/01 hit the tape in an otherwise a red sea of puts.
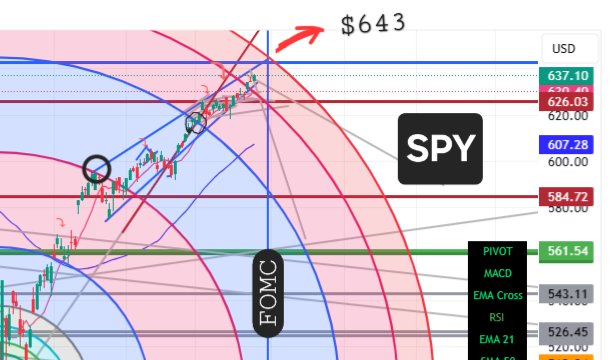
- I drew Fibonnaci circles centered at the April 7th low, shown in the picture.
- And magically, the picture shows that the confluence of the FOMC date, and the x.618 FIB extension circle intersect at $XXX. But this is where this important extension ends! It is end of the rope so to speak.
- expect another SPY push higher on Monday/Tuesday before a retreat ahead of FOMC. Wednesday = FOMC, Advanced GDP AM ⚠️, $META $MSFT ER PM. META (!!)
- Not sure how it will push more as price is kissing the Upper Bollinger!
- If it does, hedging will be active, it will be done while SPY & $VIX are rising into the important event.
- Were the bears wrong to call tops at the previous two lower FIB circles at $XXX and $626? Maybe not. This strong impulse surprised a lot of people. It is unusual not to have a 1%+ corrective move in XX consecutive days. Even May was positive! The sell in May didn't work.
- In 2019, we had a similar setup in July, Monday before FOMC, the market was up 0.5%, then down on Tuesday, flat on Wed, and X% down in X days (thu fri) post FOMC after a rate cut. Can Powell or advanced GDP spook the market enough for history to repeat on Thu? An on-time situation as the x.618 FIB ends that day! See pic.
- For those in the know, this is a key FIB level. $QQQ $TLT $TNX $USO $BTC
XXXXXX engagements
