[GUEST ACCESS MODE: Data is scrambled or limited to provide examples. Make requests using your API key to unlock full data. Check https://lunarcrush.ai/auth for authentication information.]
 #️⃣ dyor.net @DyorNetCrypto on x 84.2K followers
Created: 2025-07-20 02:22:00 UTC
#️⃣ dyor.net @DyorNetCrypto on x 84.2K followers
Created: 2025-07-20 02:22:00 UTC
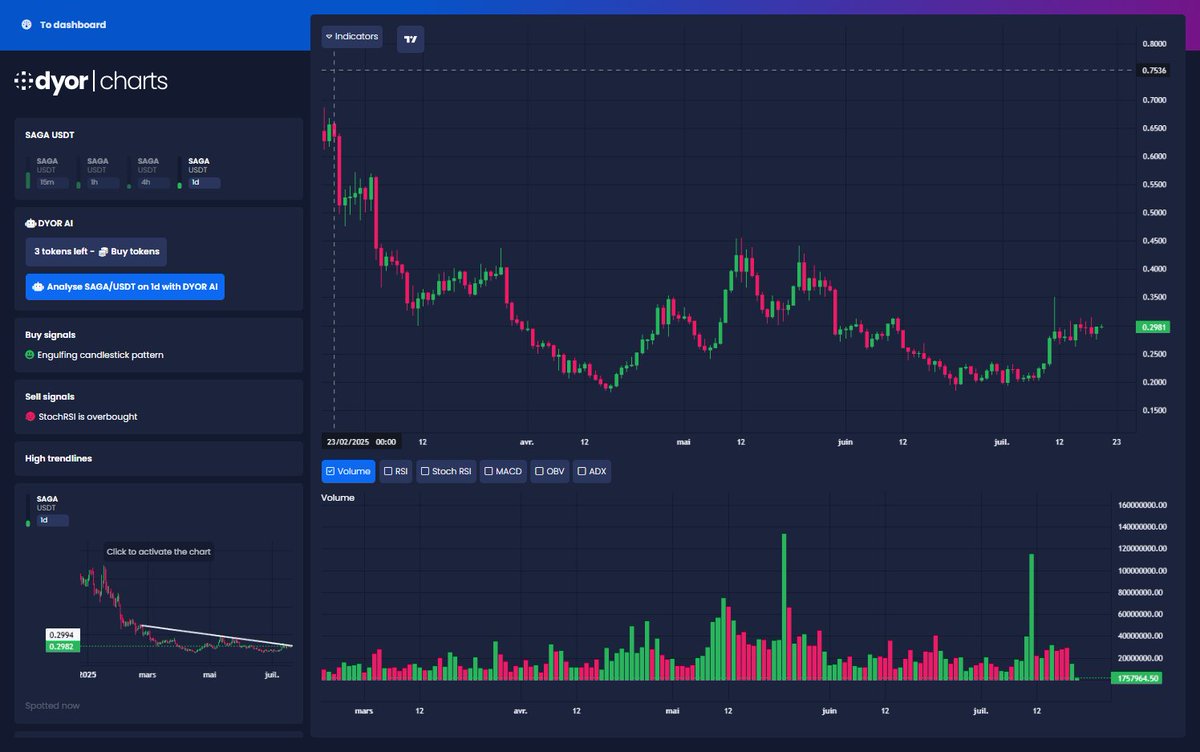
$SAGA / USDT analysis on 1d
🔍 Price Evolution and Trend Analysis The price of $SAGA has experienced significant volatility, ranging from $XXXX to a recent low of approximately $0.20, before stabilizing around $XXXXX. The current Bullish Engulfing pattern indicates a potential continuation of upward momentum, supported by an RSI of 62.57, suggesting bullish momentum without being overbought yet. The Stochastic RSI shows a reading of 85.15, indicating a short-term overbought condition, which might lead to a pullback.
📈 Resistance and Support Levels The immediate resistance is at $XXXXXX (trendline level), while strong support can be found near the MA50 ($0.252). A breach above the trendline could propel the price toward the BB High at $XXXXX. Conversely, failure to sustain above the support could trigger further declines.
🛑 Summary and Trade Suggestion Given the current signals, the outlook remains cautiously optimistic. A target price of $XXXXX is feasible, with a stop-loss set at $XXXXX to manage risk effectively. Monitoring volume and any bearish reversals will be critical for maintaining position.
This content is generated by AI and does not constitute investment advice. Do your own research before investing in any asset, and only invest what you can afford to lose.
XXX engagements

Related Topics saga rsi momentum volatility usdt $saga coins layer 1