[GUEST ACCESS MODE: Data is scrambled or limited to provide examples. Make requests using your API key to unlock full data. Check https://lunarcrush.ai/auth for authentication information.]
 #️⃣ dyor.net @DyorNetCrypto on x 84.2K followers
Created: 2025-07-19 03:28:52 UTC
#️⃣ dyor.net @DyorNetCrypto on x 84.2K followers
Created: 2025-07-19 03:28:52 UTC
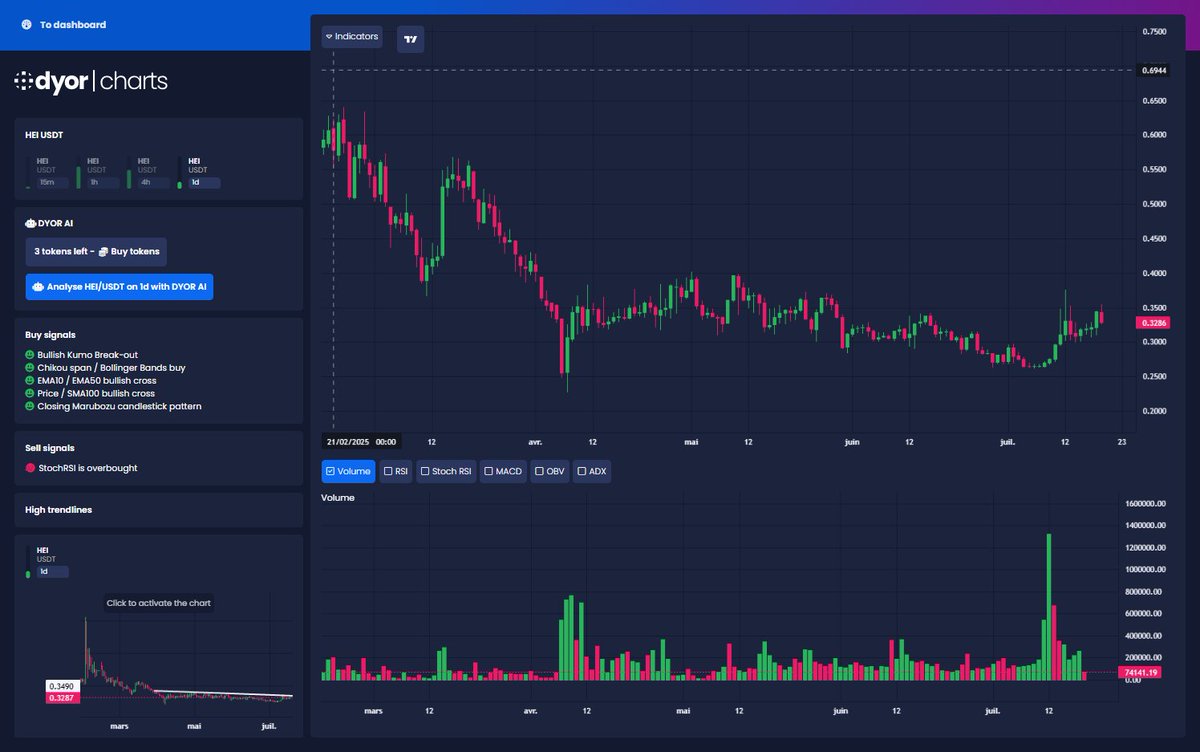
$HEI / USDT analysis on 1d
🔍 Price Analysis The $HEI token recently closed at $0.3444, showing fluctuations through a series of highs and lows that indicate volatility. With the last observed price of $0.3281, it has recently bounced off significant support levels near $XXXXXX.
📈 Trend Evaluation Current indicators show a bullish trend, supported by a Bullish Kumo Break-out and EMA crossovers (EMA10 / EMA50). However, the StochRSI indicates overbought conditions, and with a high ADX (36.67), the trend strength is notable but could suggest a pullback.
📉 Support and Resistance Key resistance lies at $XXXXXX (trendline) and previous resistance levels. Support is firmly at ~$0.3255-$0.3281. If $HEI breaks above $0.3496, it may target $XXXX thereafter.
🎯 Summary and Targets In summary, despite bullish signs, caution is warranted due to overbought indicators. Target price for $HEI could be set at $XXXX with a stop-loss at $XXXXXX to manage downside risks.
This content is generated by AI and does not constitute investment advice. Do your own research before investing in any asset, and only invest what you can afford to lose.
XXX engagements

Related Topics hei volatility token usdt $hei hei heico corp stocks industrials stocks defense