[GUEST ACCESS MODE: Data is scrambled or limited to provide examples. Make requests using your API key to unlock full data. Check https://lunarcrush.ai/auth for authentication information.]
 #️⃣ dyor.net @DyorNetCrypto on x 84.1K followers
Created: 2025-07-19 02:35:42 UTC
#️⃣ dyor.net @DyorNetCrypto on x 84.1K followers
Created: 2025-07-19 02:35:42 UTC
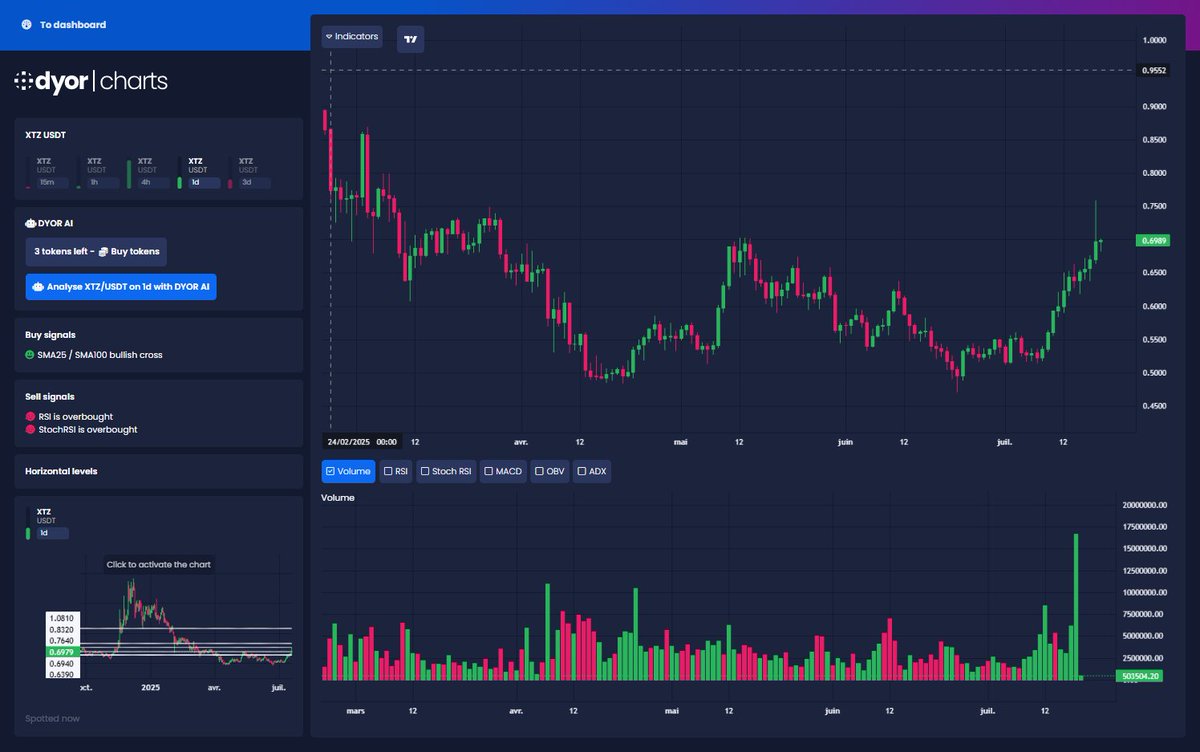
$XTZ / USDT analysis on 1d
📈 Price Evolution
The price of $XTZ has shown significant volatility, peaking recently at around $XXXXXX before pulling back to the current level of $XXXXXX. The price action suggests a bearish trend from recent highs, with a strong support level identified at around $XXXXXX based on historical values. However, the recent bullish cross of the SMA25 over SMA100 and the bullish SuperTrend signal indicate potential upward momentum if buying pressure continues.
📊 Trend Analysis
Despite the bullish indicators like RSI at 77.19, showing overbought conditions, the strength of the bearish momentum could foster a price reversal. Key resistance levels have formed near $XXXXXX (BB High) and $0.7400, while the lower Bollinger Band ($0.4710) serves as an essential support. The current ADX of XXXXX suggests an emerging trend, but lack of strong DI movement may indicate weak follows through.
⚠️ Summary & Targets
In summary, $XTZ appears to be consolidating at a crucial resistance level. If bullish sentiment can drive the price past $0.6974, targets around $XXXXXX could be realistic, with a stop-loss set at $XXXXXX to manage downside risk effectively. Conversely, failure to break through may lead to a retest of lower supports, particularly if RSI begins to correct.
This content is generated by AI and does not constitute investment advice. Do your own research before investing in any asset, and only invest what you can afford to lose.
XXX engagements

Related Topics xtz bearish volatility usdt $xtz tezos coins layer 1 coins defi