[GUEST ACCESS MODE: Data is scrambled or limited to provide examples. Make requests using your API key to unlock full data. Check https://lunarcrush.ai/auth for authentication information.]
 Dom @traderview2 on x 30.5K followers
Created: 2025-07-18 18:14:10 UTC
Dom @traderview2 on x 30.5K followers
Created: 2025-07-18 18:14:10 UTC
$XRP detailed analysis (long post, read along)
Yesterday we saw XRP hit an ATH in USD terms, but there are a few other charts we have been tracking over the last year that haven't really signaled full bull just yet
I think of all these pairings as launch checklists, the more that check the box, the stronger the trend can be
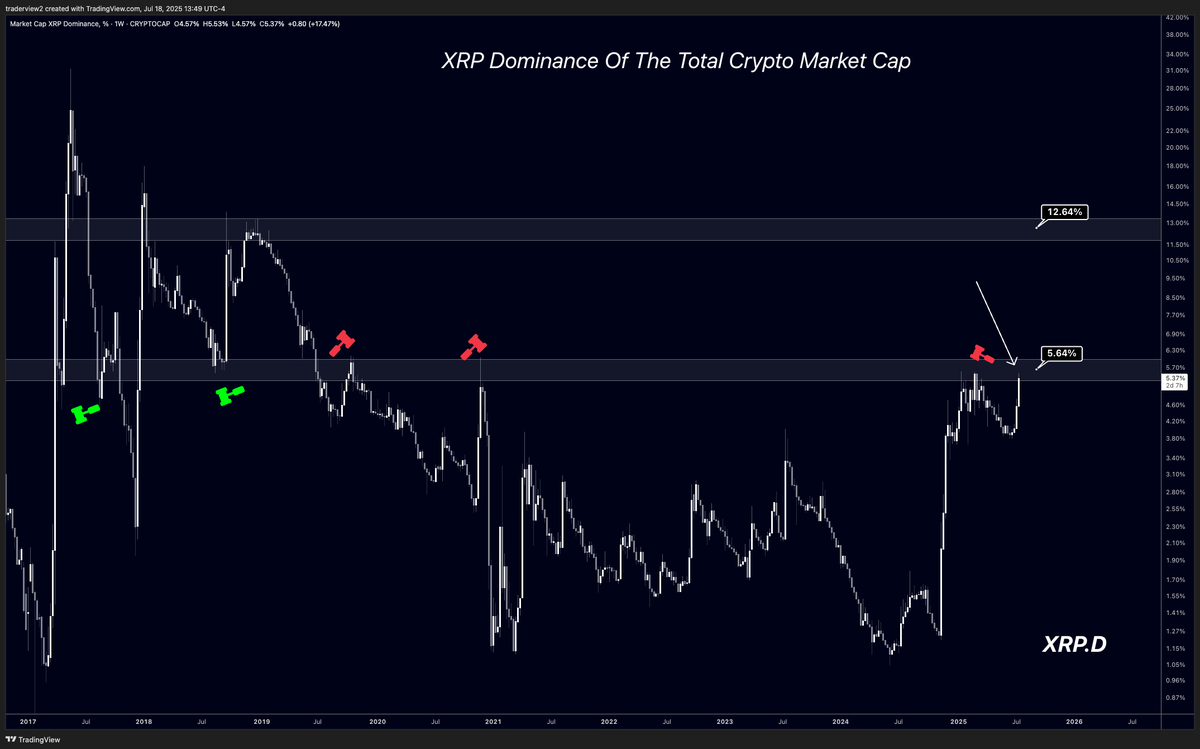
First one - $XRP.D: I tracked this chart a lot earlier this year when XRP first hit $X and here we are back to the resistance level that has held it down for over 2200 days.
Despite $XRP/USD signaling a full break of structure, the dominance chart has yet to do so.
Anytime $XRP.D broke the current resistance in the past, we saw a 2x shortly after. If history repeated after a successful break, this would land us near a target of $7-$10 depending on how much the rest of the market moves
2nd chart - $XRPBTC: This is another one we heavily tracked ~8 months ago when $XRP first was attempting to break it
Now here we are again, attempting to break the 2200+ day resistance that has rejected XRP over X times
Similar to the $XRP.D chart, anytime this has been reclaimed in the past, an explosive move occurred shortly after
I think that is implied, considering there have been 8+ rejections over the last X years...
Targets are shown once the level is cleared. I think this one is very important, so alerts are set on my end and will continue to update any advancements
3rd chart - $XRPETH: I was heavily updating this chart a few months ago right when we were attempting to break this 3200 day long zone, but XRP fell short and didn't see any follow through
Based on how $ETH has been performing, there is a chance this one is even more delayed than the previous two, but the idea stays firm
Anytime price has fully flipped the zone shown, we've only ever seen an explosive move
This is one I continue to watch, but lighter than the previous two
Last chart - $XRP / $XAU (Gold) I really like this one, considering gold is a much harder asset to price anything against, compared to USD. It gives a truer value representation, effectively eliminating some of the inflation effect of USD pairs
As we can see, XRP is still under the zone that rejected it back in 2021
Removing inflation, $XRP technically has not yet hit an ATH in "value" terms. Think of all the money printing we have seen since 2018
So this chart will be on the top of my radar. Once we clear the current zone, I think it'll be aligned with the chance of a true price discovery pump, above $X.
Thanks for reading. I hope this paints an interesting picture of the checks needed IMO for a true bull trend into the high single digits.
I'll be watching and updating these in the weeks to come.
XXXXXX engagements

Related Topics btc eth vix $xrpd united states dollar $xrp dom xrp coins defi