[GUEST ACCESS MODE: Data is scrambled or limited to provide examples. Make requests using your API key to unlock full data. Check https://lunarcrush.ai/auth for authentication information.]
 $Trader @GDXTrader on x 11.5K followers
Created: 2025-07-17 20:47:49 UTC
$Trader @GDXTrader on x 11.5K followers
Created: 2025-07-17 20:47:49 UTC
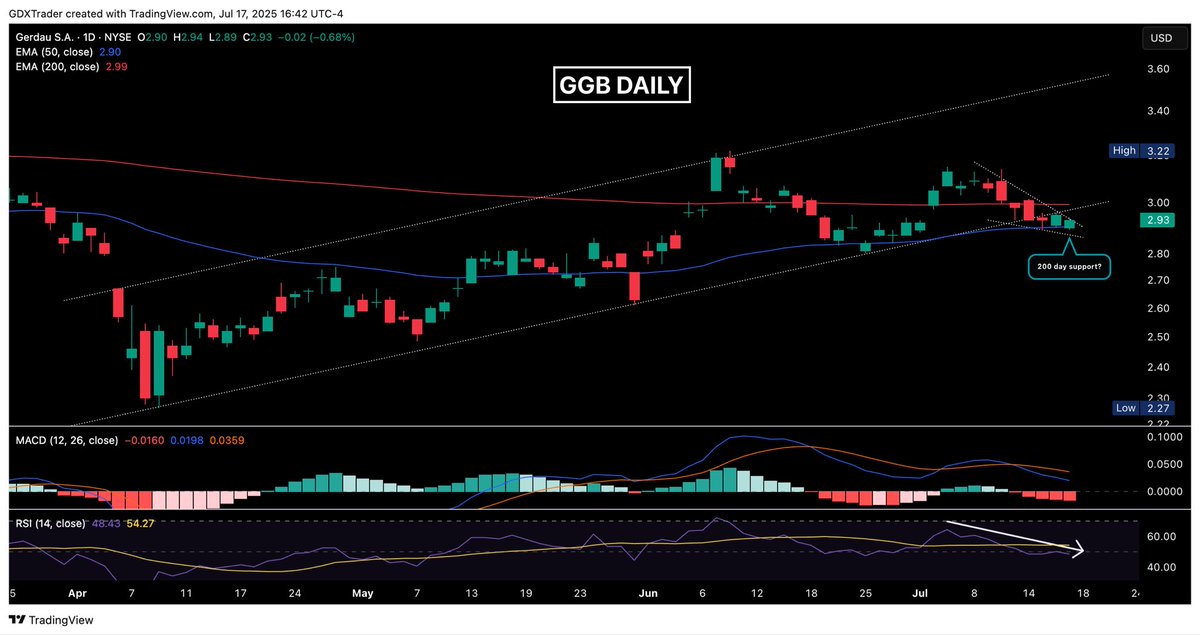
$GGB
Member Request
$GGB has shown notable weakness this week.
On Monday, it broke below its 50-day moving average, followed by a decisive loss of support from the ascending channel it had been respecting for several months.
This shift in structure signals a breakdown in bullish momentum. Price is now hovering just above the 200-day moving average, which held today with a piercing line candle — an early sign of bullish defense at this critical level.
However, momentum indicators paint a cautious picture: the MACD is widening to the downside, and the RSI continues to decline, suggesting bearish pressure remains.
A falling wedge is forming during this pullback, and while this pattern can resolve to the upside, confirmation is key.
Bulls will need to break above the wedge, re-enter the prior channel, and reclaim the 200-day to shift the tone back in their favor.
Until then, bears maintain short-term control, and the best approach here is patience.
$SID $TX $CLF $X $STLD $NUE $MT $RS $CMC $TMST $AKS $VTM
XXX engagements
