[GUEST ACCESS MODE: Data is scrambled or limited to provide examples. Make requests using your API key to unlock full data. Check https://lunarcrush.ai/auth for authentication information.]
 Senthil Kumar @Senthil14530258 on x XXX followers
Created: 2025-07-16 02:40:24 UTC
Senthil Kumar @Senthil14530258 on x XXX followers
Created: 2025-07-16 02:40:24 UTC
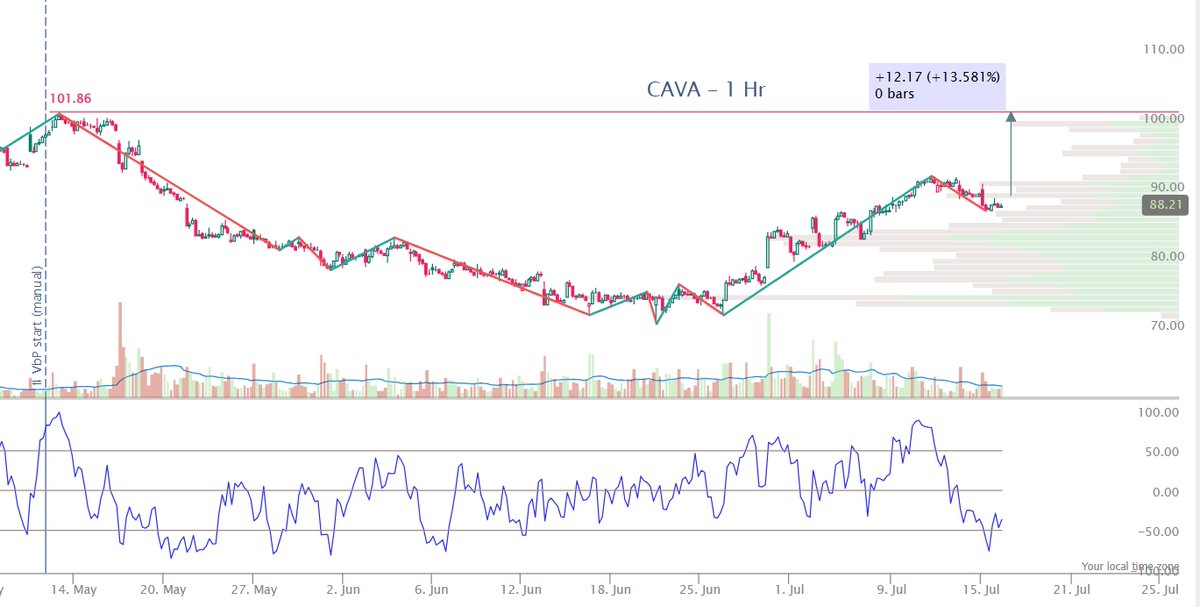
Interesting Stock Chart - Higher High and Higher low - Oversold - #6 CAVA - $CAVA - X HR
Essentially, even within a strong uptrend, (characterized by higher highs and higher lows) there can be temporary pullbacks or periods of consolidation where an stock becomes technically oversold before resuming its upward trajectory. This gives a low risk entry point
In option flow analysis , today the most options were traded at XX and XX with put call ratio of XXX . The option markets expects the price to be around XX before this week expiry which concurs with out chart analysis
XXX engagements

Related Topics $cava